Beyond the Noise: The Forgotten ‘Cosmic Clock’ That Has Governed Market Tides for Nearly a Century.
For the trader seeking a higher level of insight—one that moves beyond reactive price analysis and into the realm of true forecasting—this is the definitive guide to a method rooted in the predictable, natural rhythms that underpin market psychology.
FROM THE PRIVATE DESK OF: Jonathan Evans
LOCATION: Brisbane, Australia
DATE: Thursday, October 2, 2025
SUBJECT: The End of Guesswork. The Beginning of Confidence.
Dear Fellow Student of the Markets,
Let's have a frank discussion. You're here because you're searching for an edge. An honest-to-God, durable, real-world edge that separates the consistently profitable from the perpetually struggling.
But the path to that edge is littered with complexity and distraction. You've been told the key lies in mastering price action. You've been told the key lies in understanding liquidity. And you've been told the biggest myth of all: that the market is random—a chaotic casino where only luck determines the winners.
These ideas are not wrong, but they are incomplete. And deep down, you know it.
You've felt it in your gut. That nagging suspicion that even with the most advanced chart analysis, you're still just reacting. You spot the perfect 'order block' and the market blows right through it. You identify a 'liquidity grab', only to find you were the liquidity. You follow all the rules of modern price theory, but the results are still inconsistent.
This isn't about discarding your knowledge of price action. It's about adding a foundational layer of timing and direction that makes your existing skills exponentially more effective.
The Agony of Being the "Smartest Guy to Go Broke"
The world of modern trading, from ICT to Smart Money Concepts, has given us a powerful new language to describe price movement. It's a massive leap forward from old-school indicators. But it has a fatal flaw: it makes you feel like a genius while it quietly bleeds your account dry.
'Order Blocks' and 'Fair Value Gaps' are brilliant at explaining *why* the market reversed from a certain level. They provide a clear, logical narrative for price action that has already occurred. But they are footprints left in the sand; they tell you where the "smart money" *was*, not necessarily where it is *going*.
'Liquidity Grabs' and 'Market Structure Shifts' give you a framework for understanding the mechanics of a move. You learn to see the market as a mechanism for seeking and taking liquidity. But this still keeps you in a reactive state, waiting for the market to show its hand before you can act. You are perpetually trying to outsmart an invisible opponent who makes the rules.
These sophisticated methods create an illusion of control. They give you a logical reason for every win and every loss, but they can't answer the most important question of all: What is the most probable *direction* of the market's pressure over the next week or month?
But what if you could know the weather forecast before the game even started?
The Proof is in the Past: A Pattern of Predictable Turning Points
Case Study #1: The 2008 Financial Crisis
Talk is cheap. Let's look at the evidence. One of McWhirter's most powerful discoveries was her "Secondary Factors"—a specific set of planetary angles that measure the underlying bullish or bearish pressure in the market. When these factors accumulate on one side, the market tends to follow.
Below is a chart of our proprietary Secondary Factors indicator during the 2007-2008 period. Notice how the bearish pressure (red) began building to extreme levels throughout 2007, giving a clear, advance warning of the catastrophic decline to come—long before the panic hit the mainstream.
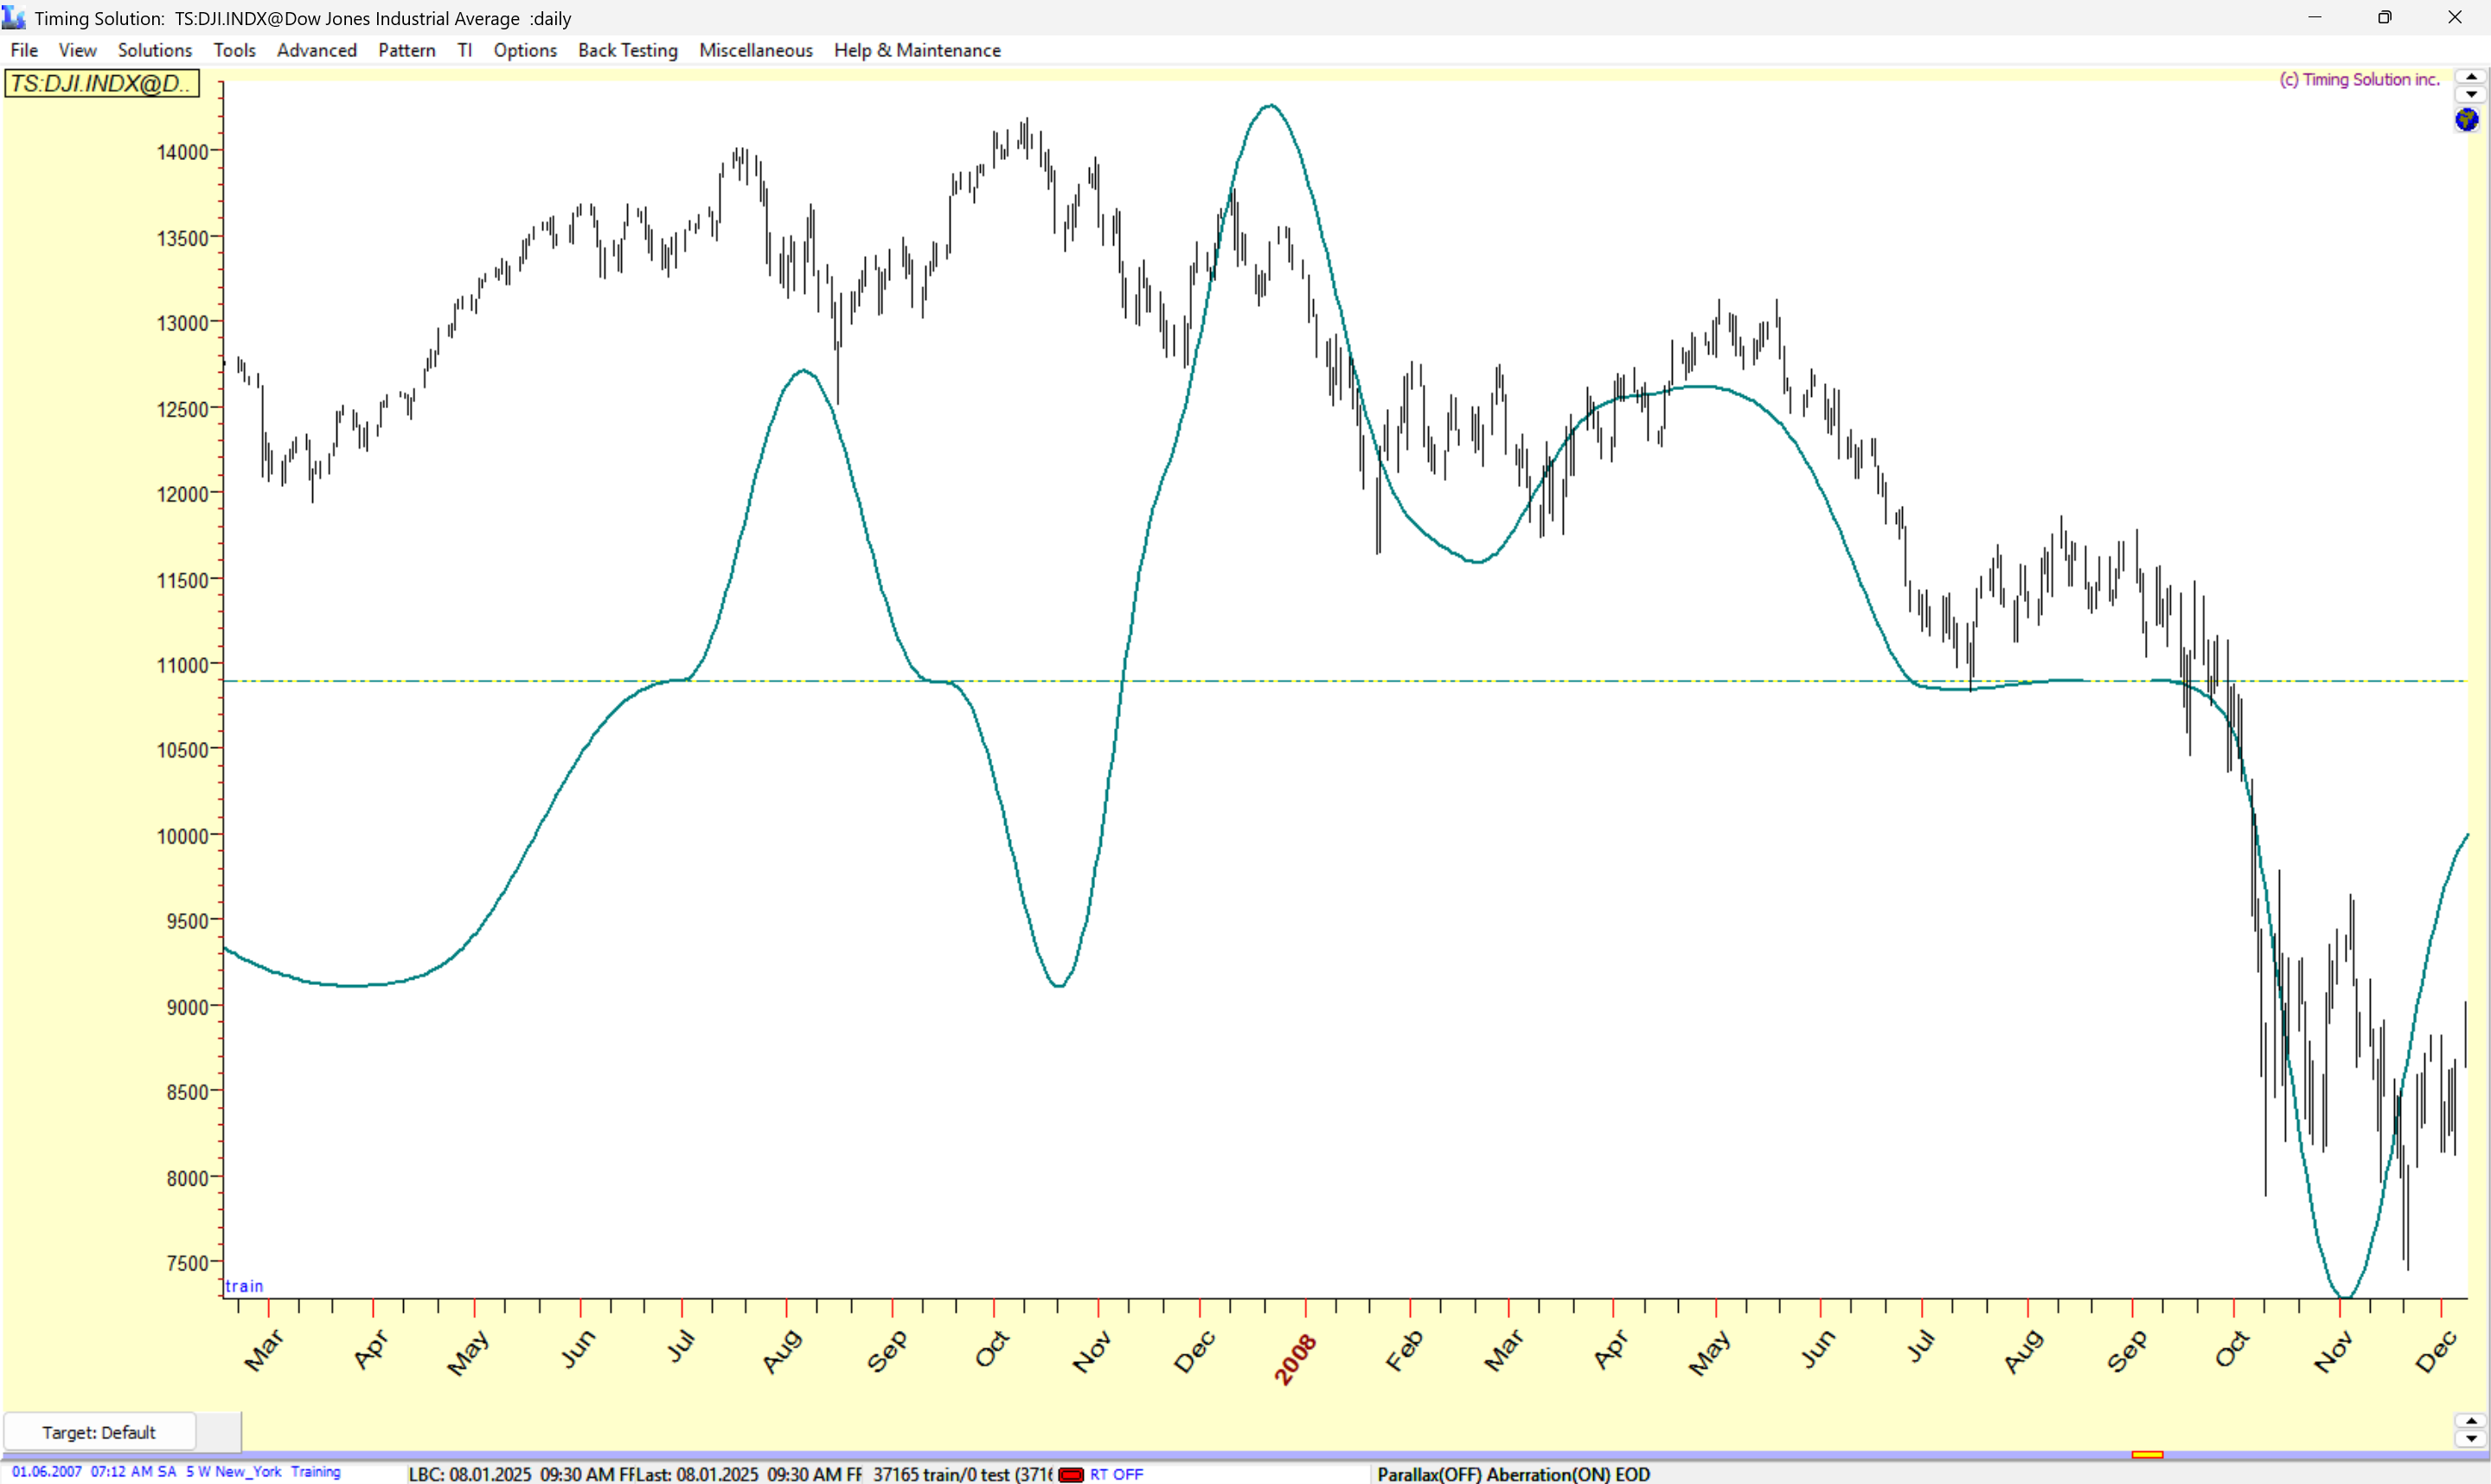
Our proprietary indicator showing extreme bearish "Secondary Factors" building throughout 2007, forecasting the 2008 crash.
This is not hindsight. This is a mechanical, repeatable measurement of market sentiment. While price action traders were looking for confirmation, students of this method were already positioned for the storm.
Case Study #2: Navigating the 2011-2012 Volatility
This method doesn't just call major crashes. It provides clarity during periods of intense chop and uncertainty. During the European Sovereign Debt Crisis of 2011-2012, many traders were whipsawed by violent swings. But the Secondary Factors tool showed a clear pattern: a battle between bullish and bearish forces, with neither able to gain a sustained advantage. This signaled a range-bound market, providing the invaluable insight to trade tactically or simply wait for a clearer trend to emerge.
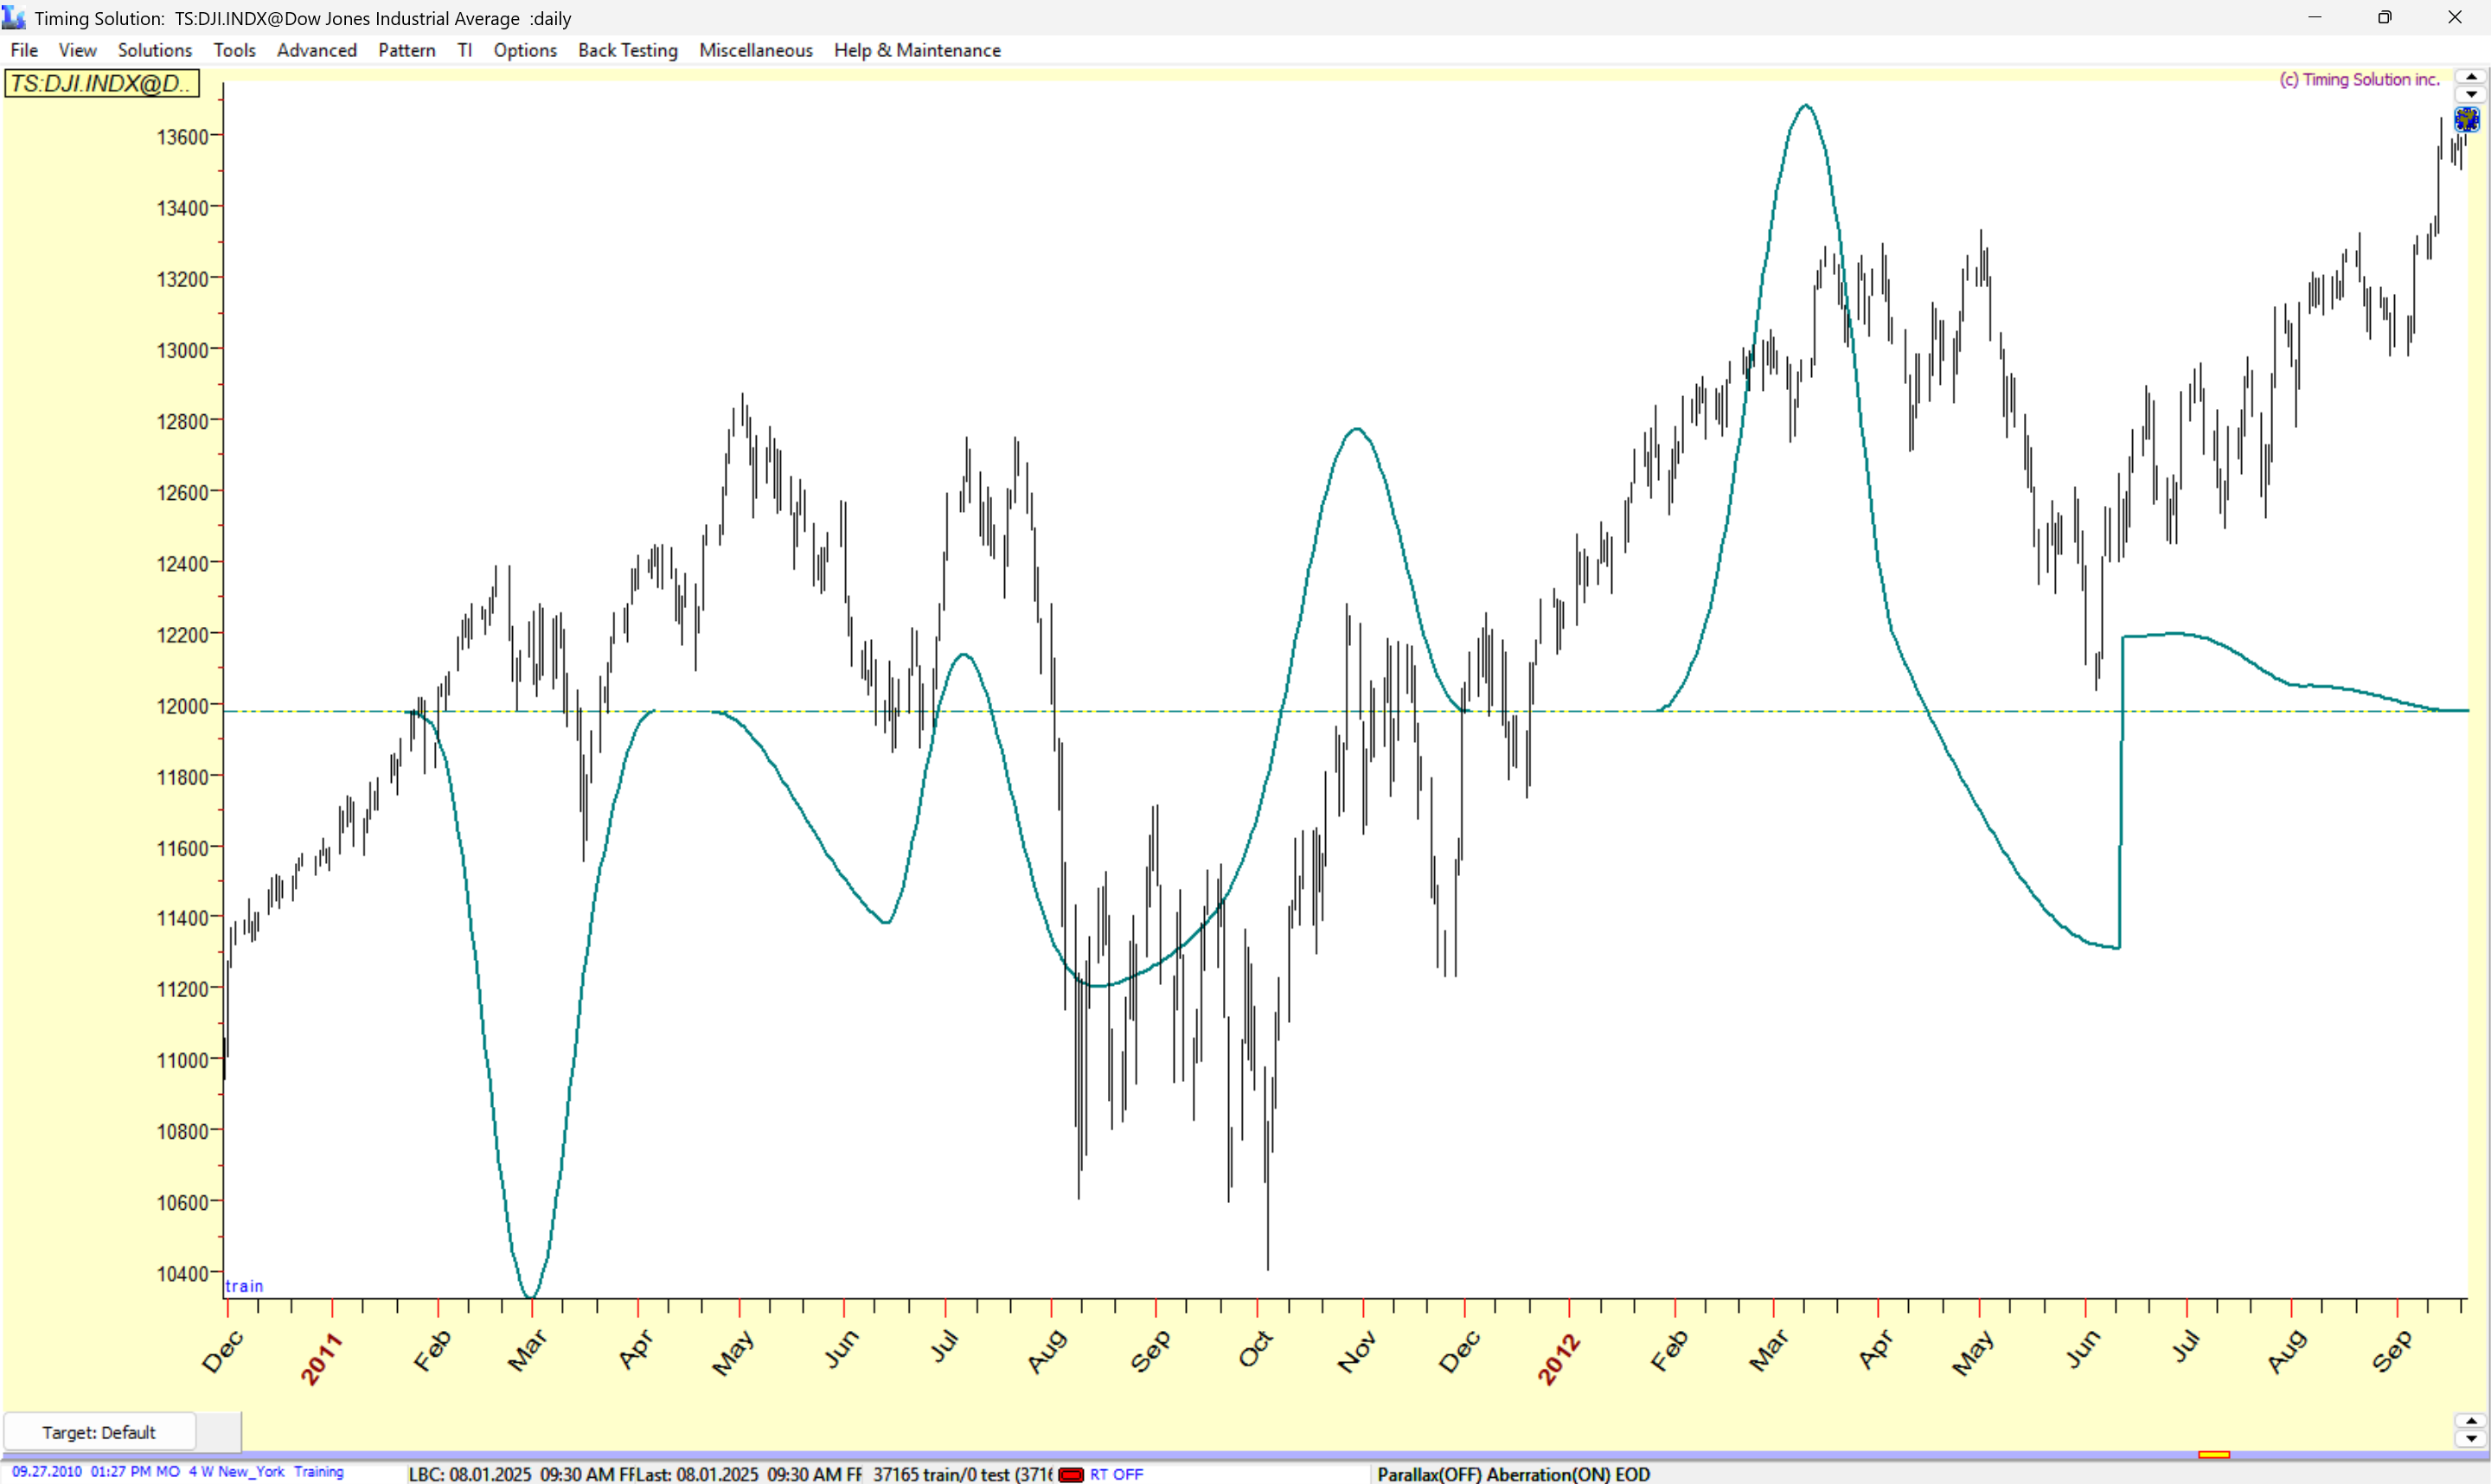
The indicator showing a volatile equilibrium between bullish and bearish factors, correctly identifying the choppy, range-bound market of 2011-2012.
Case Study #3: Calling the 2022 Downturn
More recently, after the historic rally of 2020-2021, many believed the market could only go up. Yet, as early as late 2021, the Secondary Factors began flashing a warning. A powerful wave of bearish pressure was building, even as the indexes were making their final highs. This gave our students a critical advance signal of the major trend change that defined 2022, allowing them to protect capital and profit from the downturn while others were still buying the dip.
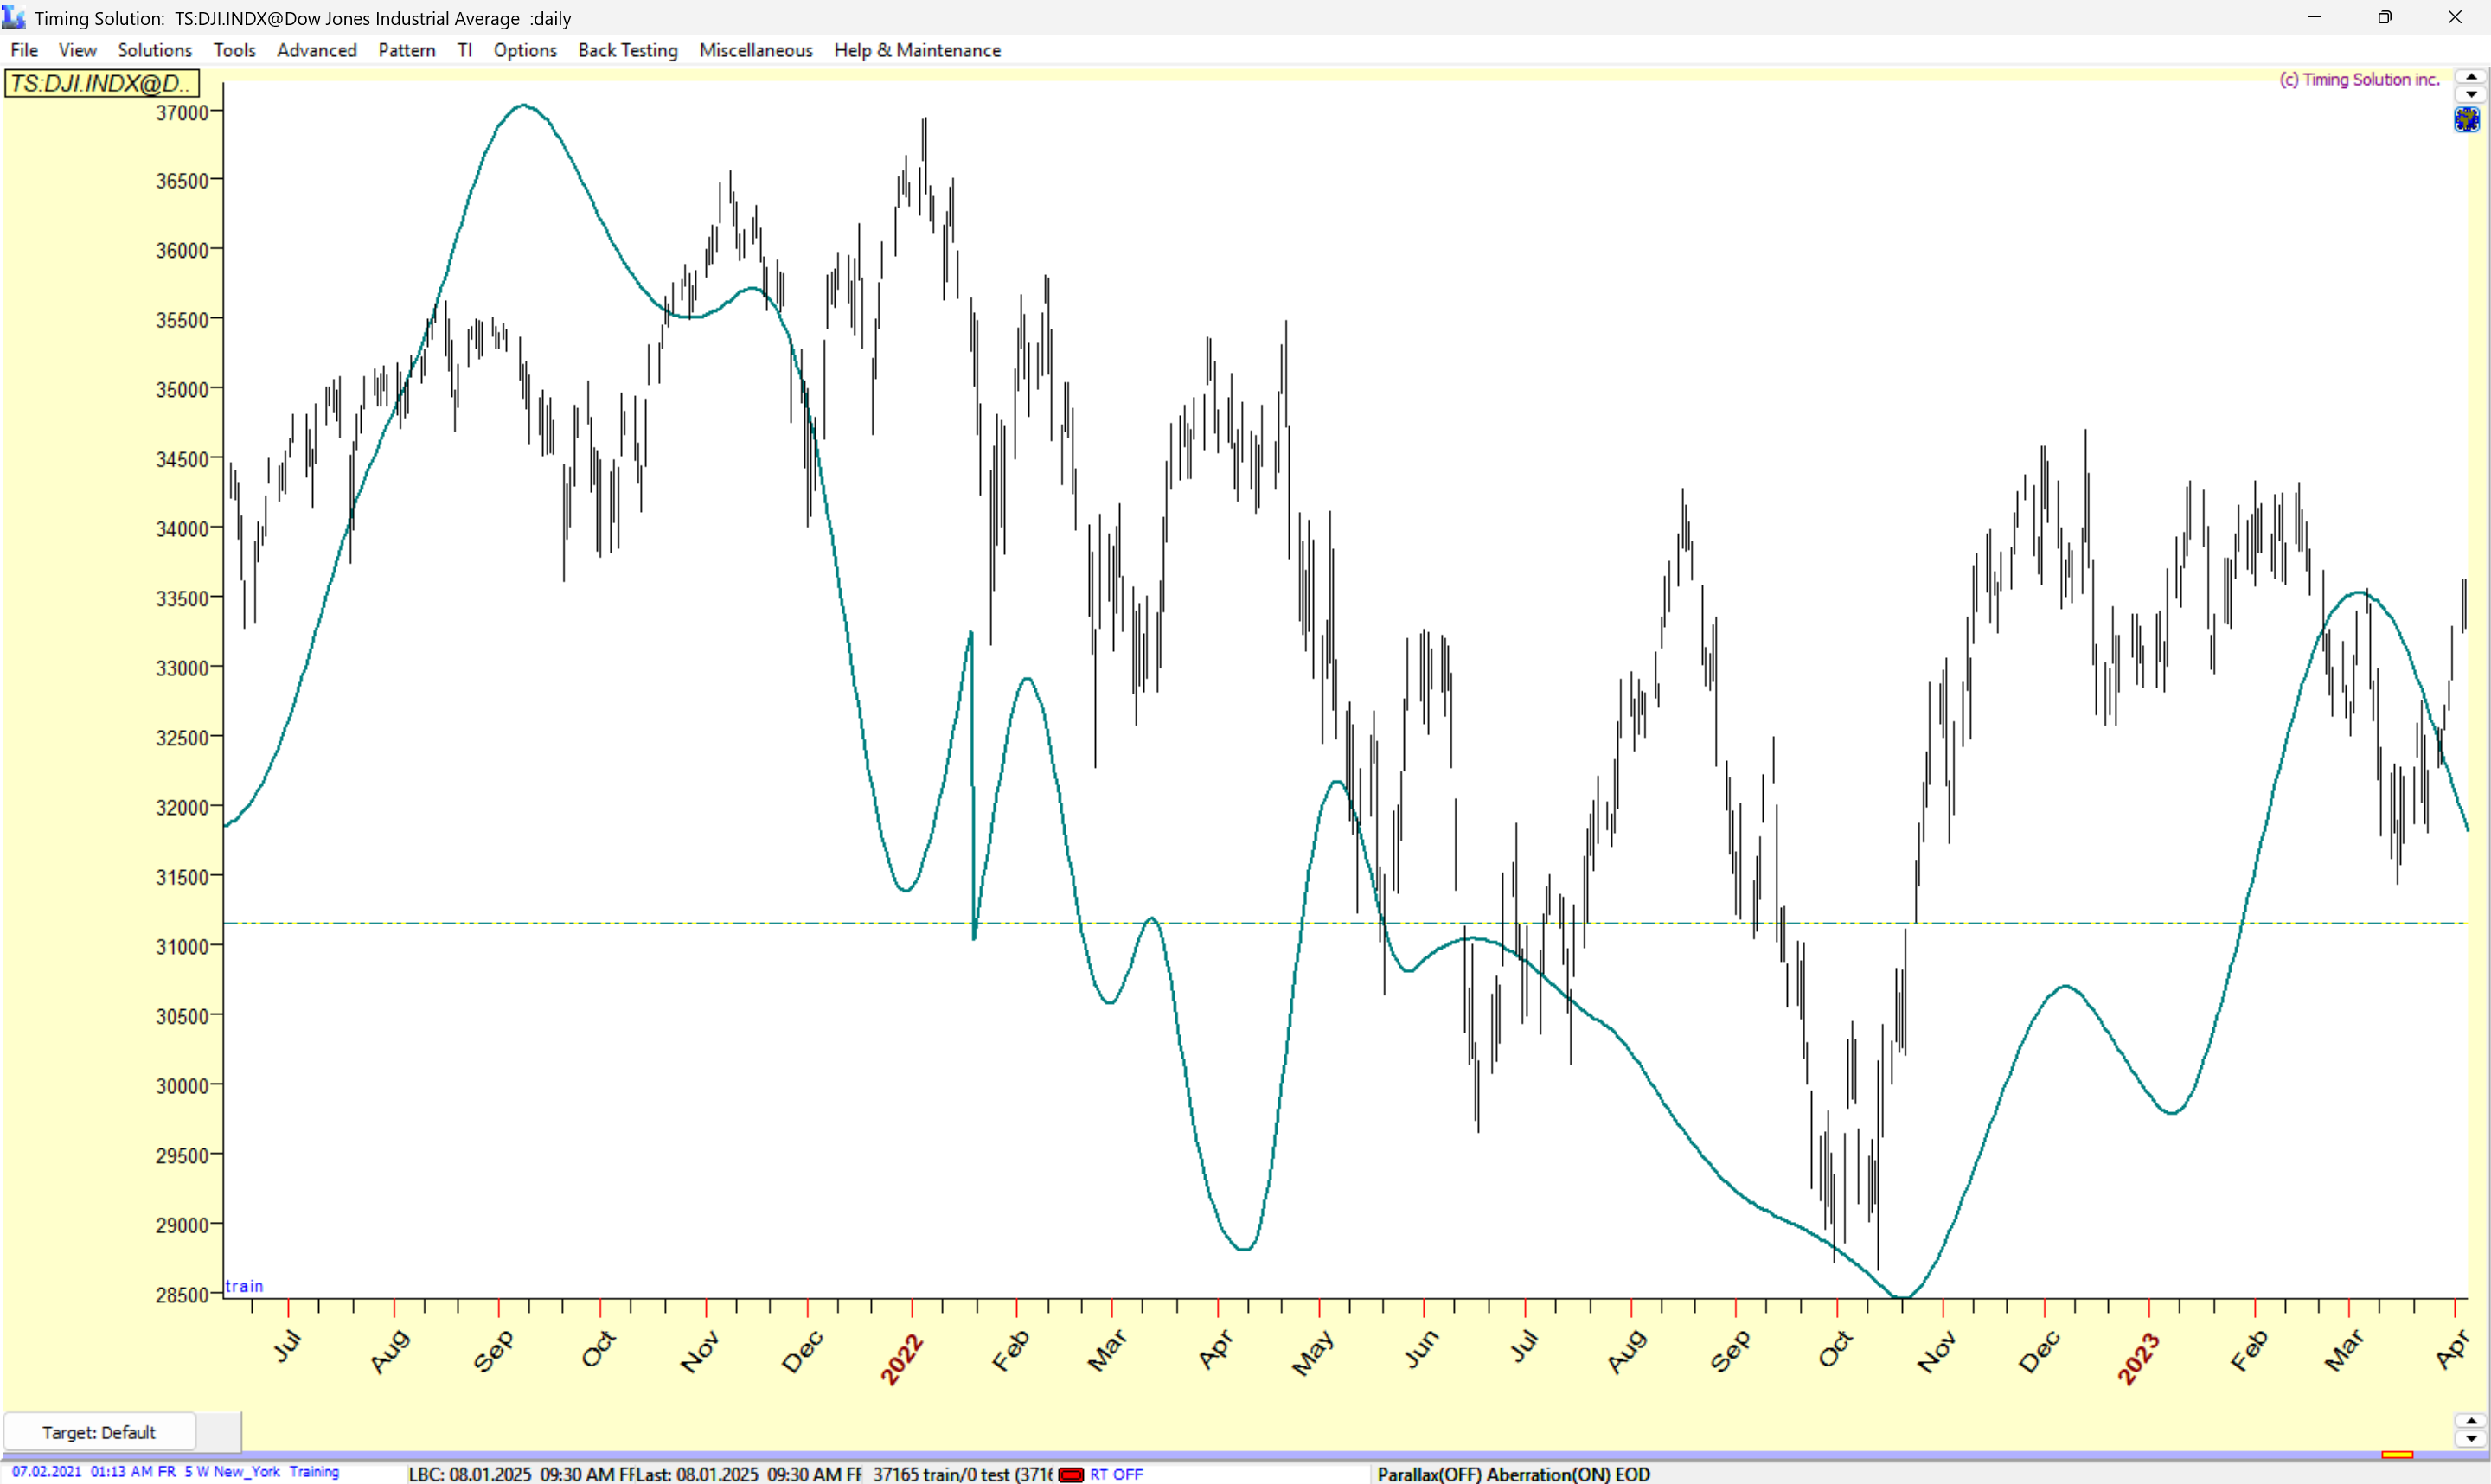
Bearish factors building in late 2021, providing an advance warning for the 2022 bear market.
What Real Traders Are Saying...
"I came from a heavy ICT background. I could explain any chart in hindsight perfectly. But my P&L was flat. The McWhirter Method was the missing piece. It gave me the directional bias. Now my ICT entries have a 70% tailwind instead of a 50/50 coin flip. My win rate has doubled, and my stress has vanished. This isn't a replacement for price action; it's the foundation it should have been built on."
"The 'Personal Clock' module was worth the price of admission alone. It was like reading my own psychological autopsy. I finally understood why I was always early on short trades and late on long trades. It wasn't my fault; it was my 'financial DNA.' Knowing my own patterns has been more profitable than any chart pattern I've ever learned."
As Above, So Below: The Natural Rhythm of the Market
For centuries, the most brilliant minds in history—from farmers to admirals to kings—understood a simple truth: our world moves in predictable cycles. The seasons, the tides, the patterns of agriculture... all are governed by the majestic, clockwork precision of the cosmos.
The "boom and bust" cycle is not a modern invention. It is a natural phenomenon. It is the result of mass human psychology—the rhythmic swing between optimism (bullishness) and pessimism (bearishness). And what is the greatest driver of these mass psychological tides? The very same celestial bodies that pull upon our oceans and govern our seasons.
This isn't a belief system. It's an observation of natural law. A law that was first scientifically applied to the stock market not by a Wall Street insider, but by a brilliant woman who spent years in quiet, meticulous research, uncovering the financial Rosetta Stone.
An Excerpt from the Archives: The Woman Who Gave Wall Street a Calendar
The year is 1936. America is still haunted by the ghost of the Great Depression. The ivory tower economists have failed. The politicians are grasping at straws. The investing public is terrified.
But in a quiet study, armed with stacks of financial data going back a century and an astronomical almanac called an ephemeris, a financial astrologer named Louise McWhirter was connecting the dots. She wasn't guessing; she was calculating. She was observing a pattern so consistent and so powerful that it could only be one thing: a law of nature.
She published her findings in a book, "McWhirter Theory of Stock Market Forecasting." It didn't make a splash in the mainstream. It was too strange, too far outside the box. But among a small circle of elite, professional traders, it became an underground legend. They saw it for what it was: a monthly calendar for Wall Street's mood swings. A tool that told them when to expect bullish currents and when to brace for bearish tides.
But her book was not a simple instruction manual. It was a treasure map, written in code, with crucial pieces missing.
This is the critical point. This is why you haven't heard of this method from your favorite trading guru or seen it on YouTube.
Simply reading her book today is a guaranteed path to failure. Her language is archaic. Her calculations are done by hand. She assumes a level of astronomical knowledge that has been lost to the modern trader. She gives you the "what," but she deliberately veils the "how."
It is a system that is as powerful as it is incomplete. And for decades, those missing pieces have kept this incredible forecasting tool out of the hands of all but the most dedicated researchers.
Until now.
After thousands of hours of research, of testing, of hitting the same brick walls that stumped so many others, I have finally located the missing keys. I have decoded her system and retrofitted it for the 21st-century trader. And for the first time ever, I am making the complete, decoded methodology available to a small group of serious students.
The Three Clocks of Louise McWhirter
The Complete, Decoded System for Market Forecasting
McWhirter's work is not one single theory; it is a nested system of three distinct "clocks," each governing a different layer of the market. To be a successful forecaster, you must know how to read all three. This is what separates the masters from the amateurs.
Clock #1: The Generational Clock (The 18.6-Year Master Cycle)
This is the great tide. It moves slowly, but its power is absolute. It determines the economic "season" you are in. Are you planting in the spring of a new boom, or harvesting in the autumn before a long winter? This clock tells you.
Clock #2: The Monthly Market Clock (The NYSE Lunation Model)
This is the tactical secret weapon. This clock provides a high-probability forecast for the market's direction over the next 28 days. The mechanism is pure genius: the New York Stock Exchange, born on a specific date, has a "birth chart." The monthly New Moon (the "lunation") activates this chart, and its aspects to the NYSE's planets create bullish or bearish pressure.
Clock #3: The Personal Wealth Clock (Your Investor DNA)
This is the most personal and transformative part of her work. Why does one investor thrive with a system while another fails? Because we are not all built the same. Your personal birth chart is a unique map of your psychological strengths and weaknesses. It reveals the markets you are naturally suited for and the timing of your personal "power periods."
This Isn't Just a Course. It's A New Pair of Eyes.
Imagine knowing at the start of each month the market's most probable directional bias. Imagine having the confidence to hold a winning trade through noisy pullbacks because you understand the underlying tide is in your favor. Imagine seeing major turning points develop weeks in advance, long before they appear on any price chart.
Imagine the profound calm that comes with this knowledge. The end of anxious guesswork. The end of being whipsawed by news headlines. The end of fighting the market, and the beginning of flowing with it.
This isn't about being right 100% of the time. No system can promise that. This is about replacing a 50/50 gamble with a 70/30 or 80/20 statistical edge. It's about trading with the current, not against it. It's about ending the guesswork, forever.
Introducing: The McWhirter Method Unlocked
The Definitive Training on Systematic Market Forecasting
I have organized my entire decoded system into a comprehensive, step-by-step video program that leaves no stone unturned. You get everything. Nothing is held back.
Module 1: The Generational Clock - Mastering the 18.6-Year Tide (Value: $497)
Before you can trade the waves, you MUST understand the tide. This module makes you a master of the long-term economic weather.
- The complete illustrated history of the Boom/Bust cycle in America, from the Panic of 1857 to the 2020 crash, all explained through the lens of the North Node's cycle.
- How to precisely identify the four distinct "seasons" of the cycle and which asset classes are primed to outperform in each.
- The exact zodiacal signs that mark the "Transition Periods" from bull to bear and bear to bull, giving you months of advance warning.
Module 2: The Monthly Clock - The NYSE Forecast Engine (Value: $997)
This is the core of the system. You will learn the precise, mechanical method for generating a high-probability market forecast for the 30 days ahead.
- The verified, correctly calculated 1792 Natal Chart of the NYSE—this "Rosetta Stone" of the market is your essential map.
- A complete video guide to the "Planetary Powers": discover why Jupiter is expansion, Saturn is restriction, and Uranus is explosive, unexpected moves.
- The step-by-step process of analyzing each month's New Moon ("lunation") to determine the market's bias.
- My "McWhirter Rulebook" which clearly lists the bullish and bearish aspects, ranked by strength and reliability.
Module 3: The Personal Clock - Decoding Your Financial DNA (Value: $500)
This is where the system becomes truly personalized. This module alone is life-changing.
- A simple, step-by-step guide to creating your own, 100% accurate astrological birth chart for free.
- How to locate and interpret the 2nd House (your money), 5th House (your speculation), and 10th House (your career) to understand your unique financial psychology.
- Discovering your "Chart Ruler" and how its condition reveals your greatest strengths and hidden weaknesses as an investor.
- How to use personal transits from Jupiter (opportunity) and Saturn (challenge) to find your personal "power periods."
Your Unfair Advantage: The Forecaster's Toolkit (Value: $1294)
This is more than a course; it's an arsenal. We have built a suite of proprietary software tools based on the hidden work of McWhirter and another forgotten master, Lt. Dr. David Williams. These tools do the complex calculations for you, turning esoteric knowledge into actionable data. No one else has these.
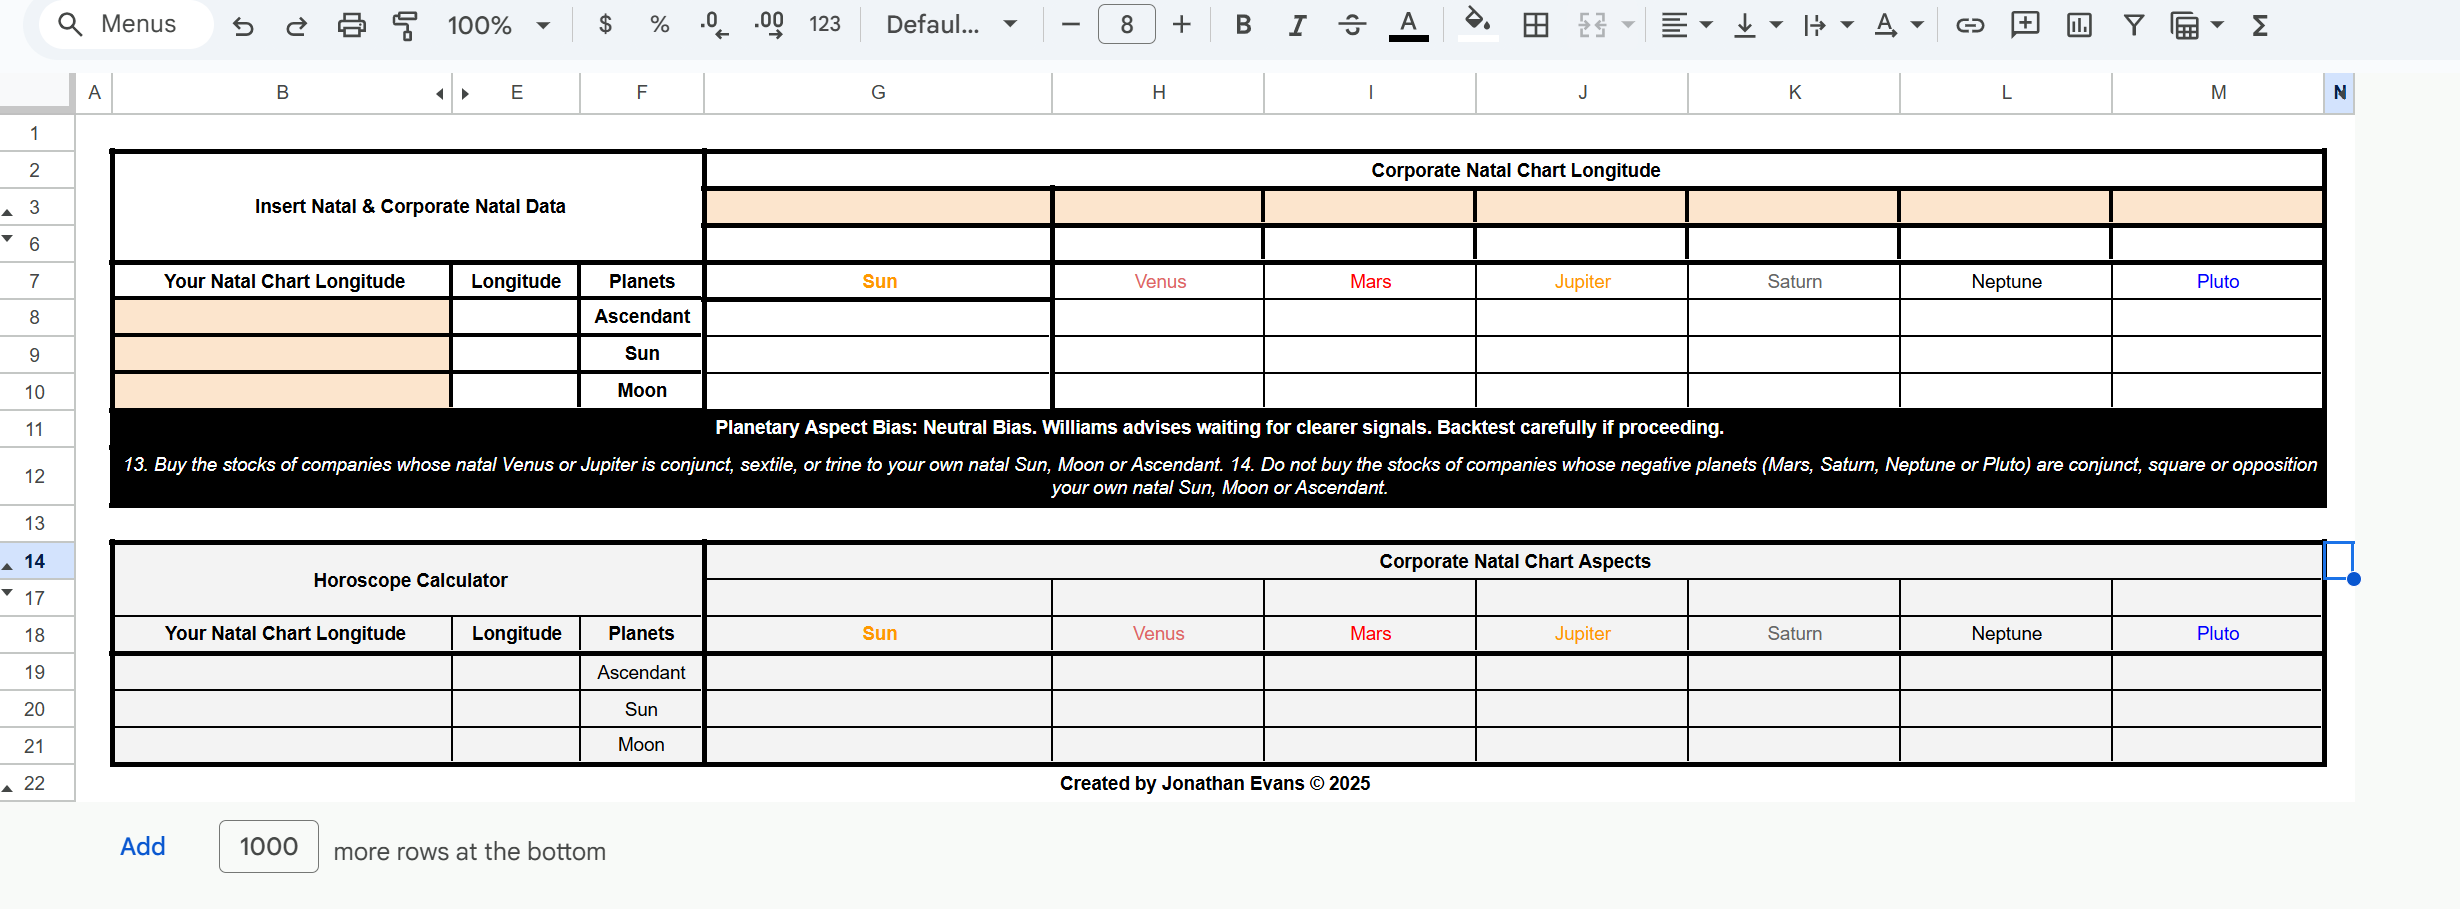
Corporate Compatibility Calculator
Monthly Aspectarian Forecaster
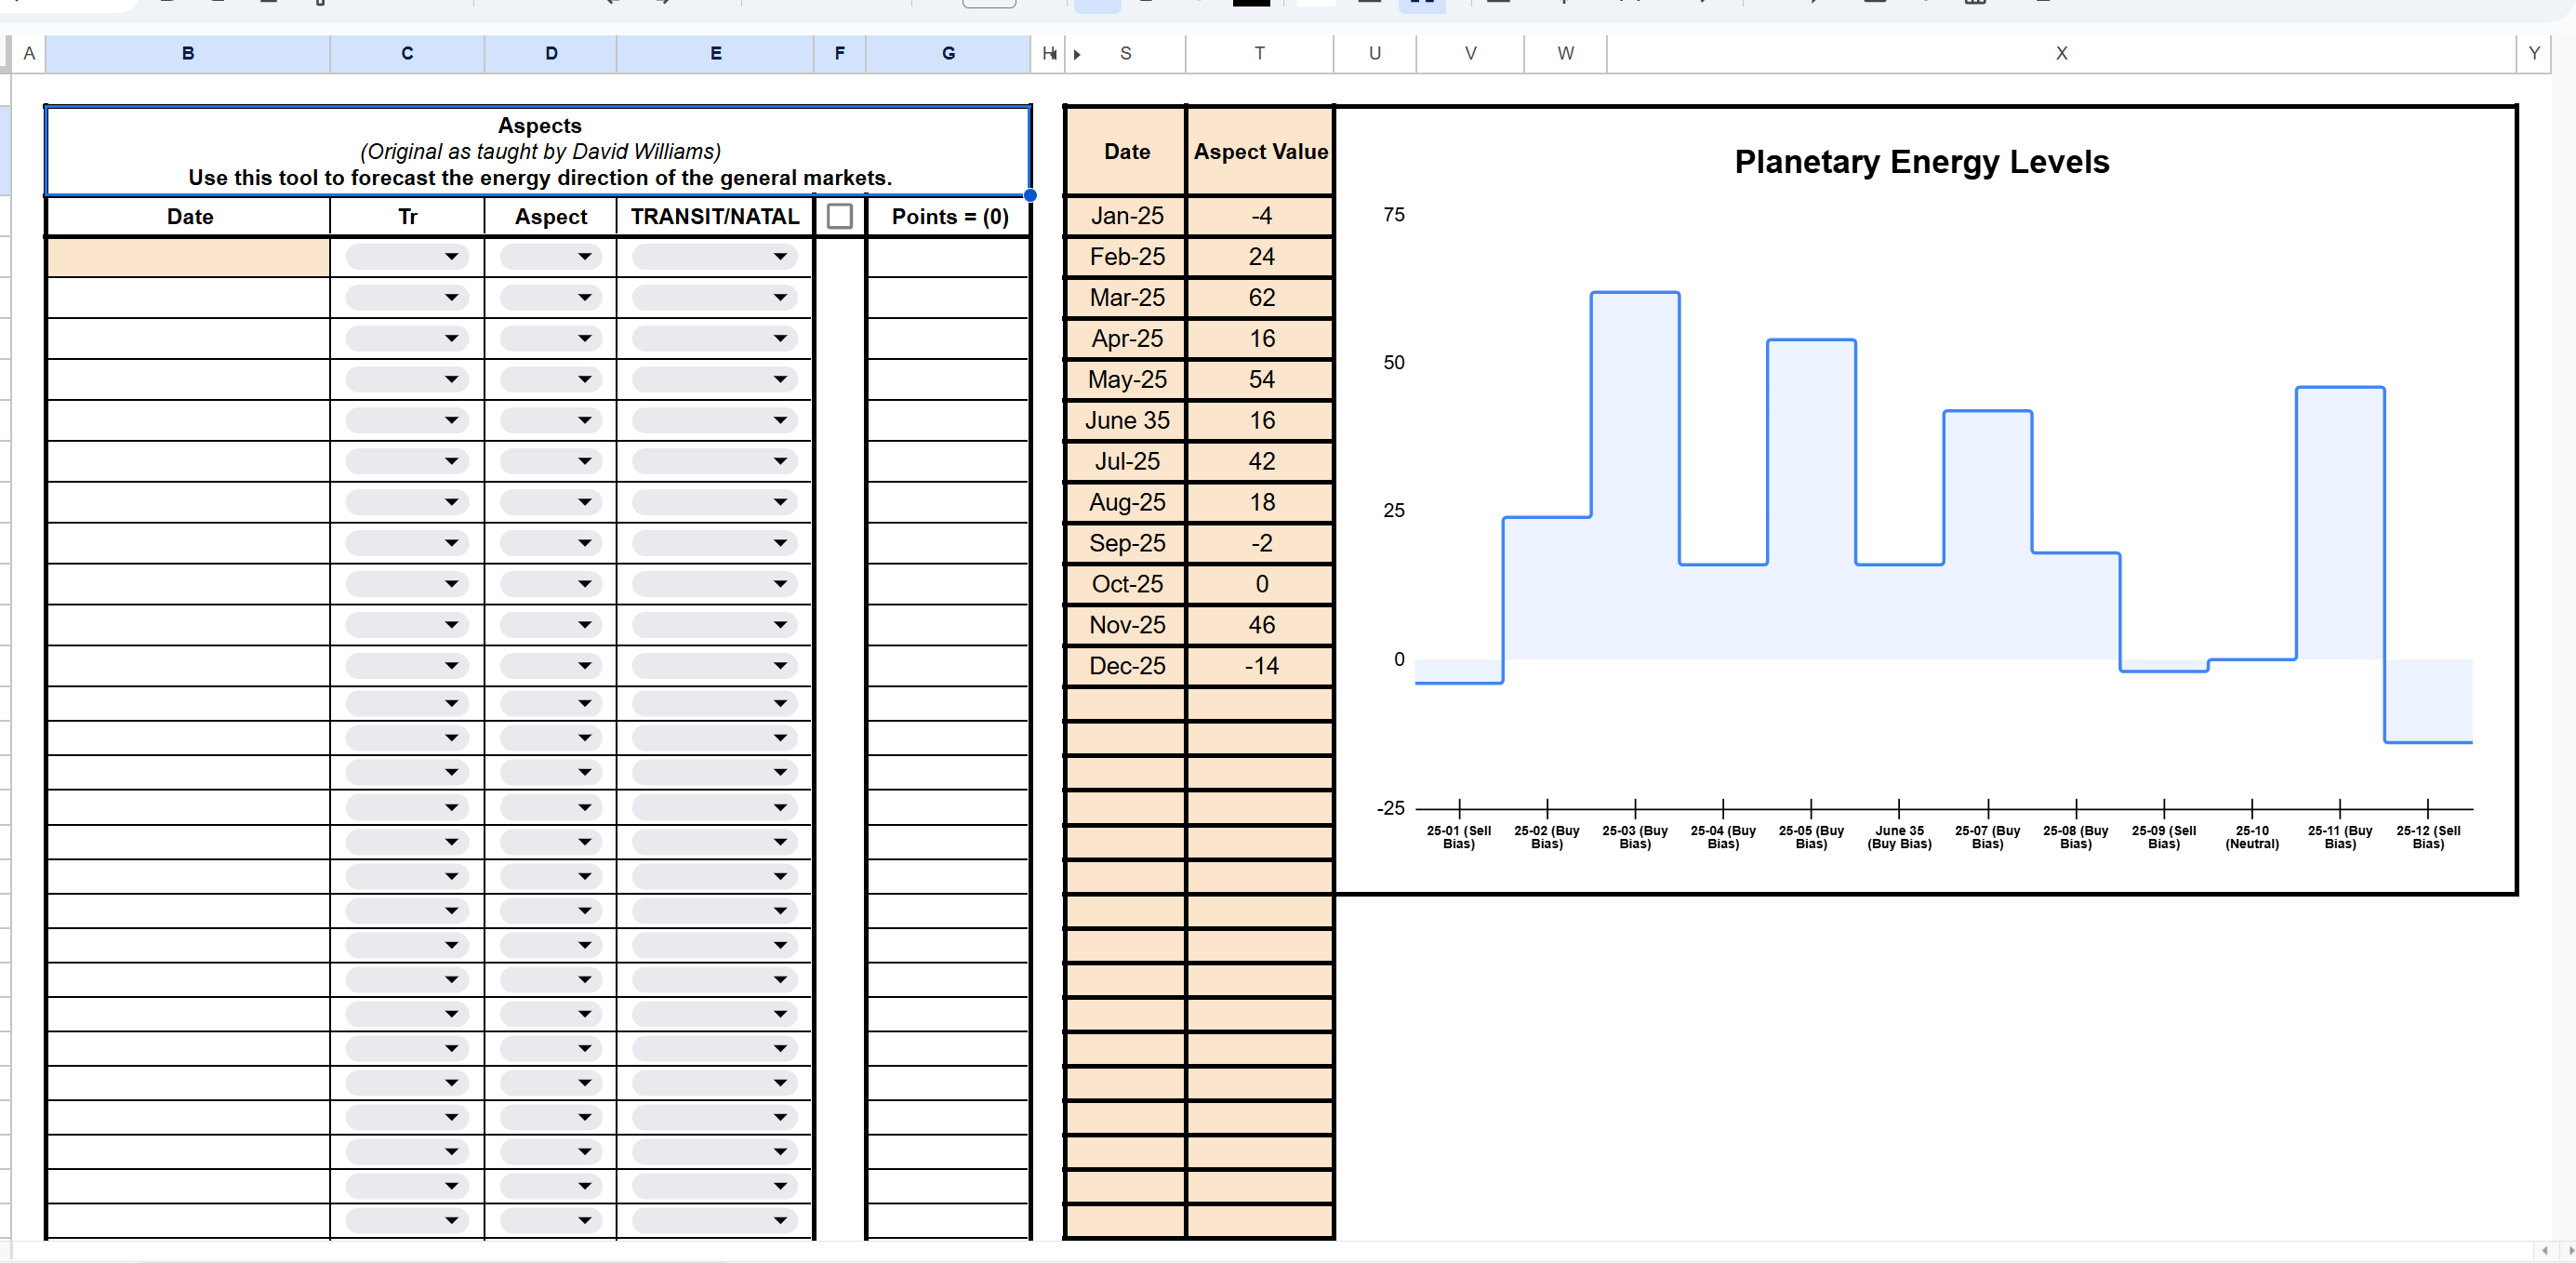
You receive lifetime access to our custom-built calculators, including the Secondary Factors Indicator shown in the case study, the Corporate Compatibility Calculator to see if you're in sync with a stock, and the Monthly Aspectarian Forecaster which derives a buy/sell bias based on total planetary energy.
LIMITED TIME SUPER BONUS:
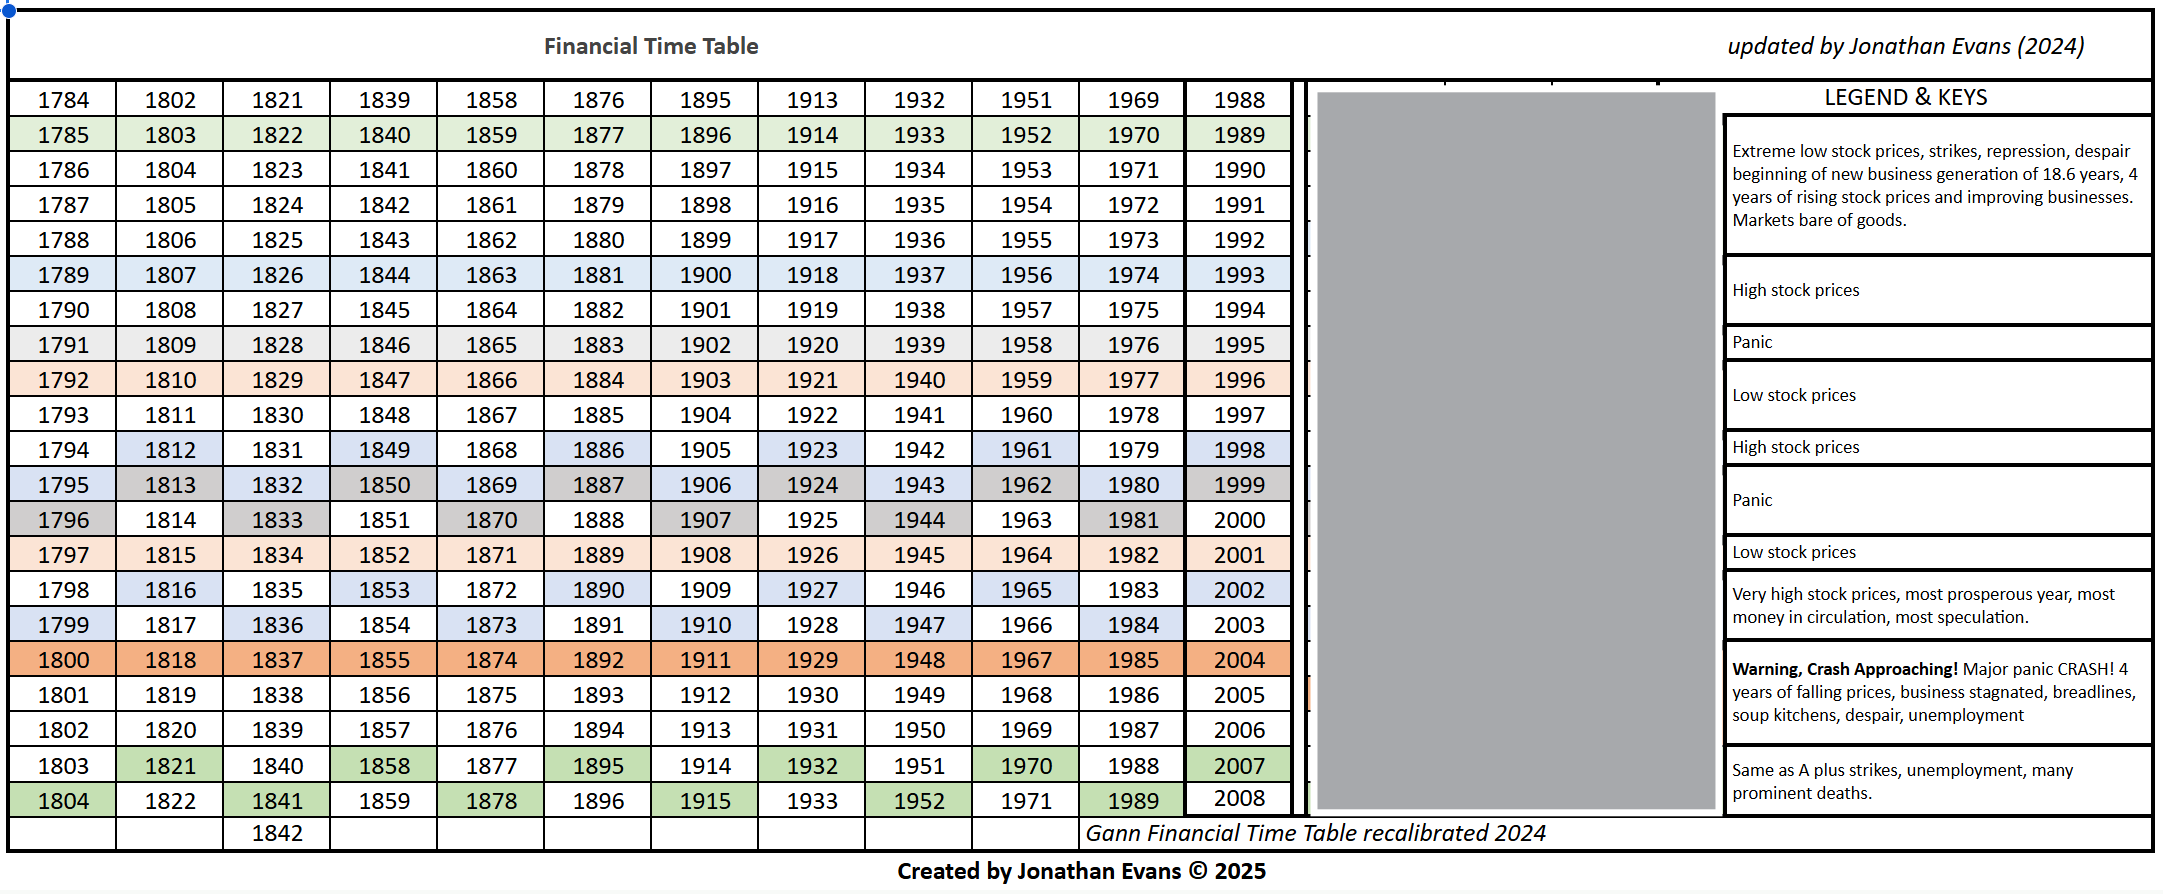
My Complete "Gann Financial Timetable Unlocked" Course (Value: $897)
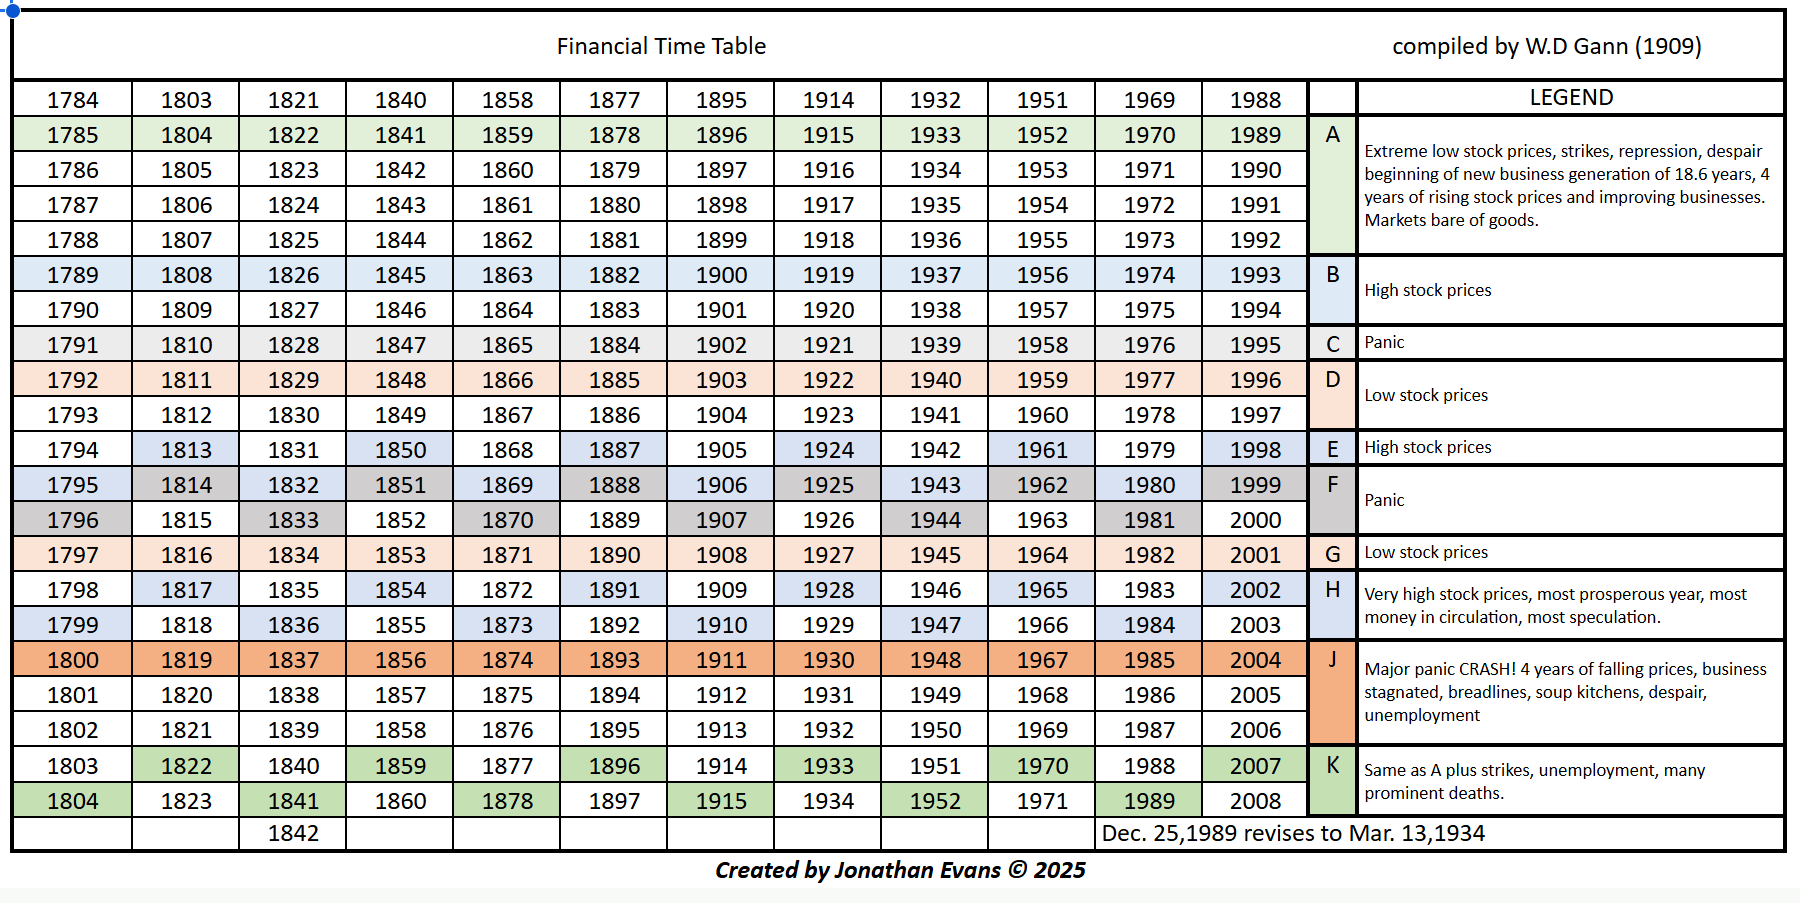
W.D. Gann and Louise McWhirter were two sides of the same golden coin. To give you a complete, unparalleled education in cycle theory, I am including my entire, bestselling Gann course for free. You will learn to build the REAL Financial Timetable from the ground up.
Below is a glimpse of the proprietary tools and templates you will receive. We've concealed the most sensitive data—the formulas and forecasts are reserved exclusively for students.
Gann's Original Timetable
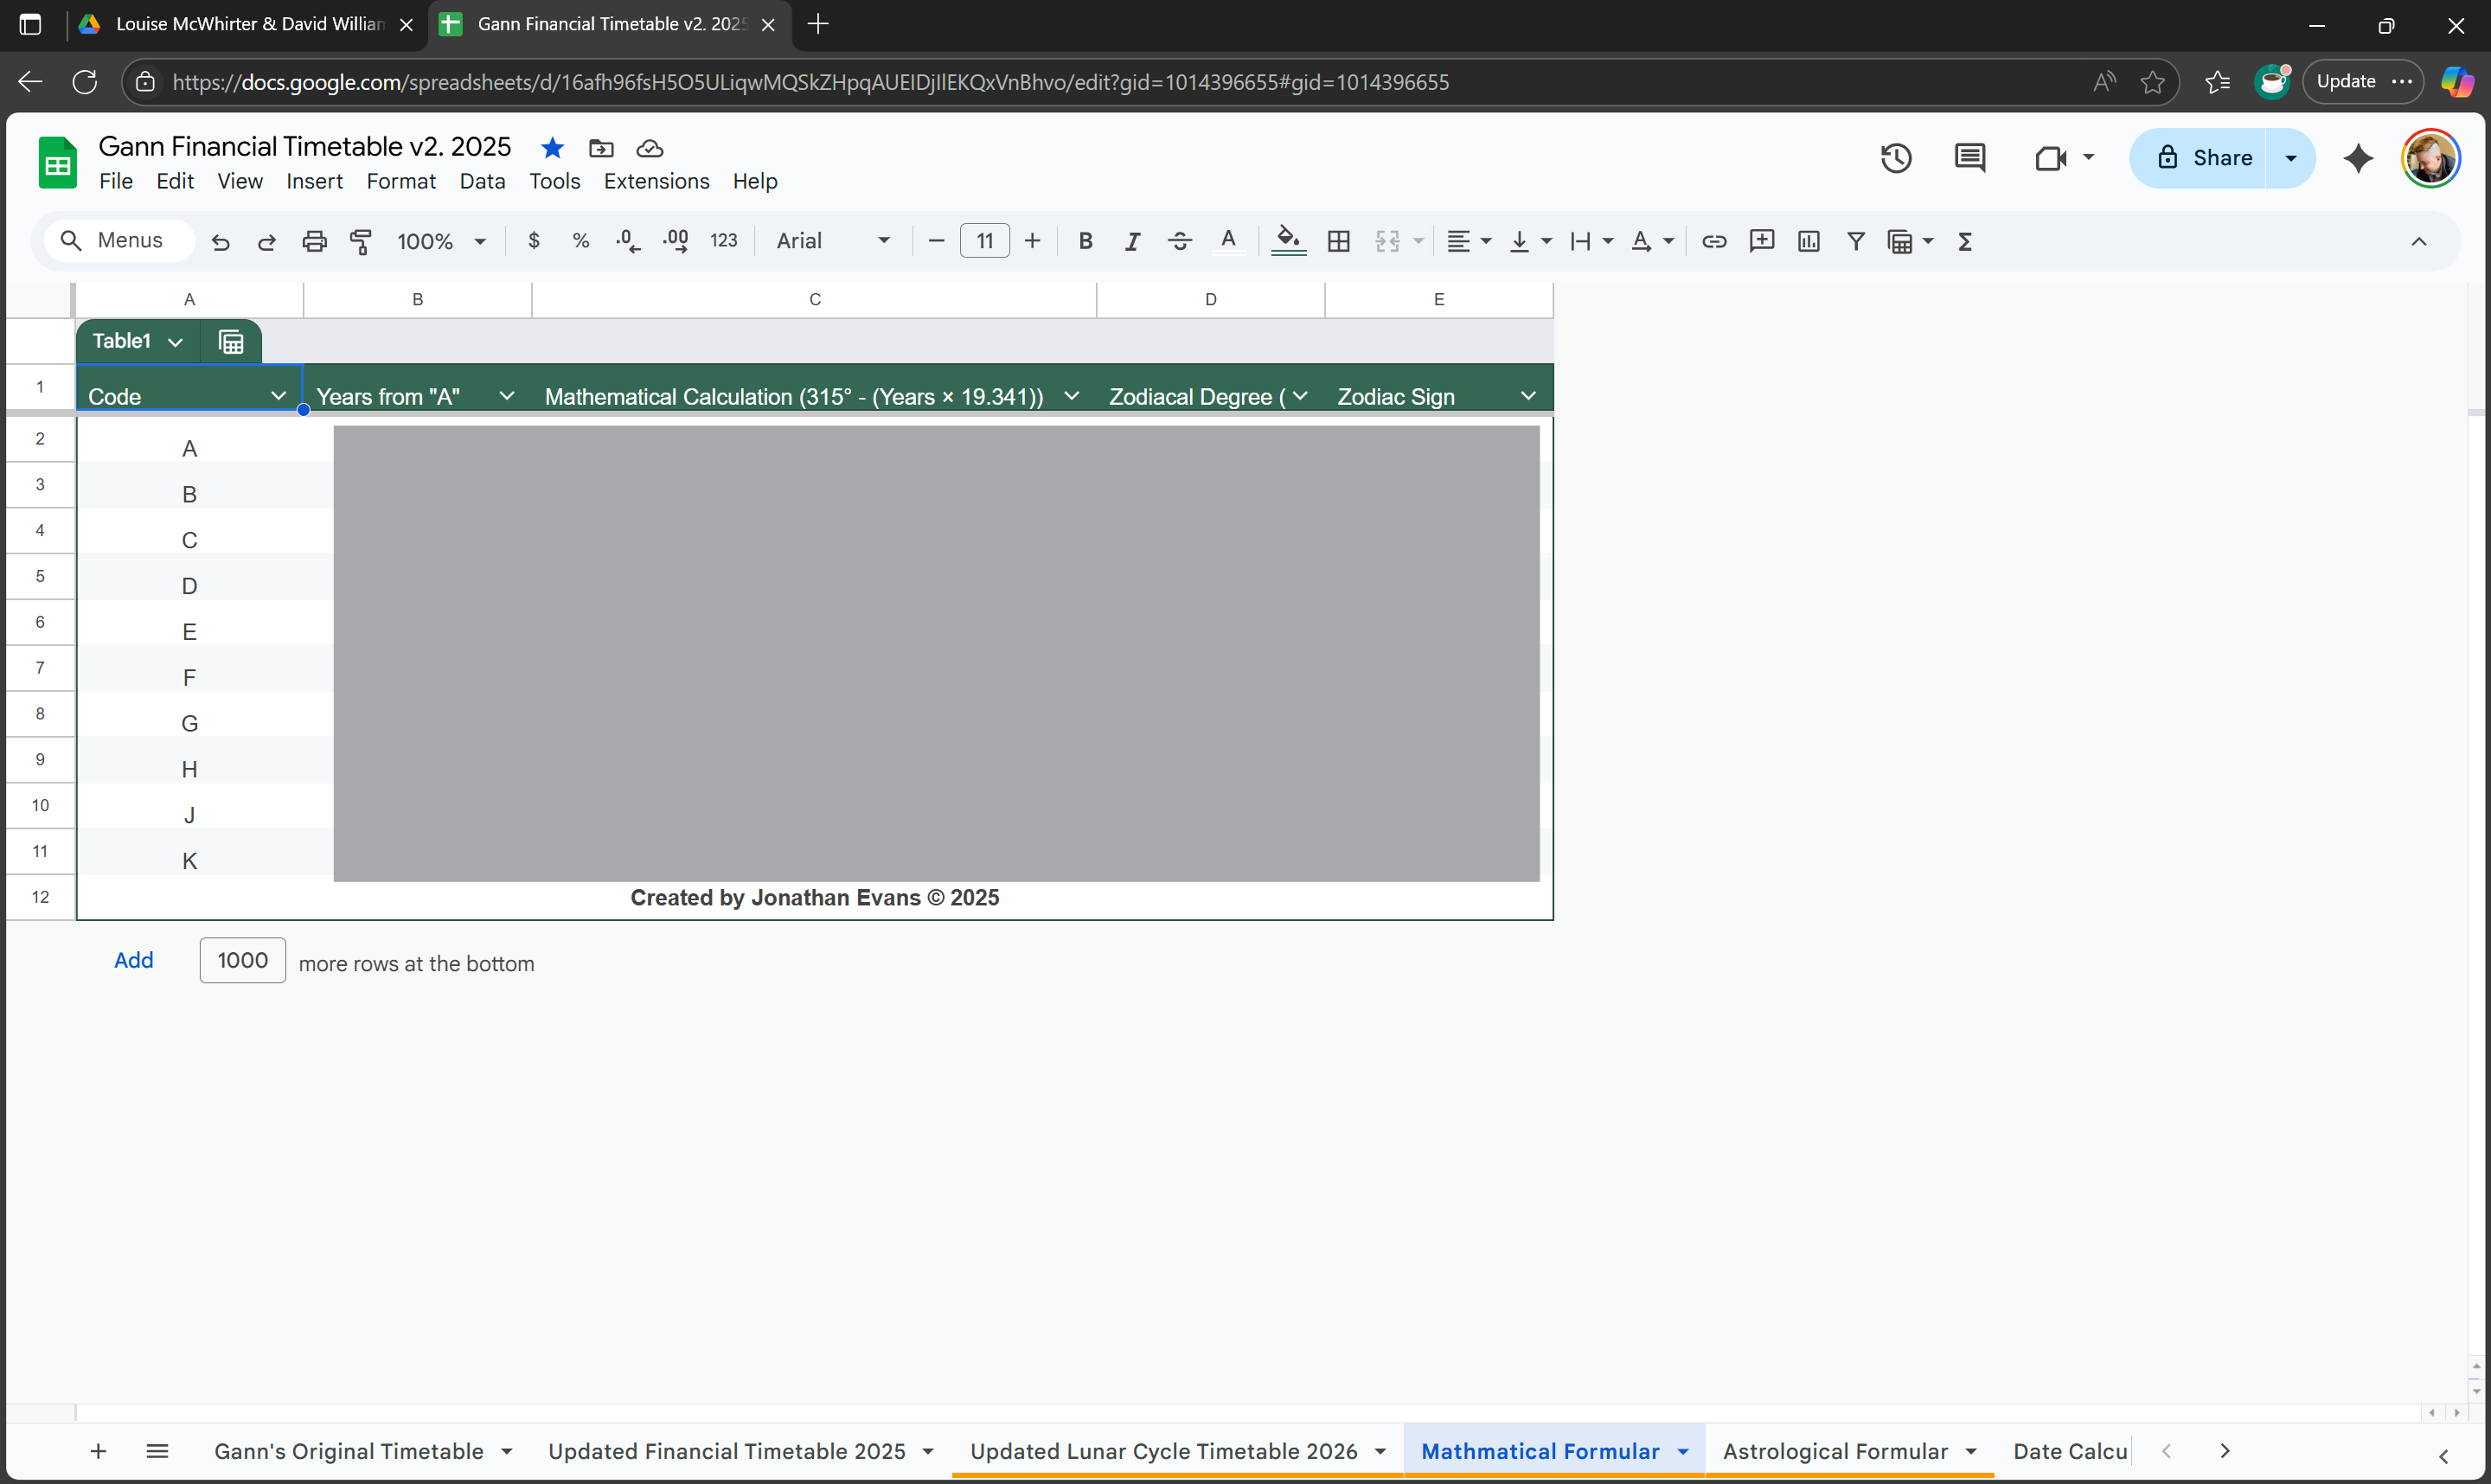
The Hidden Math Formula
Proprietary Lunation Table
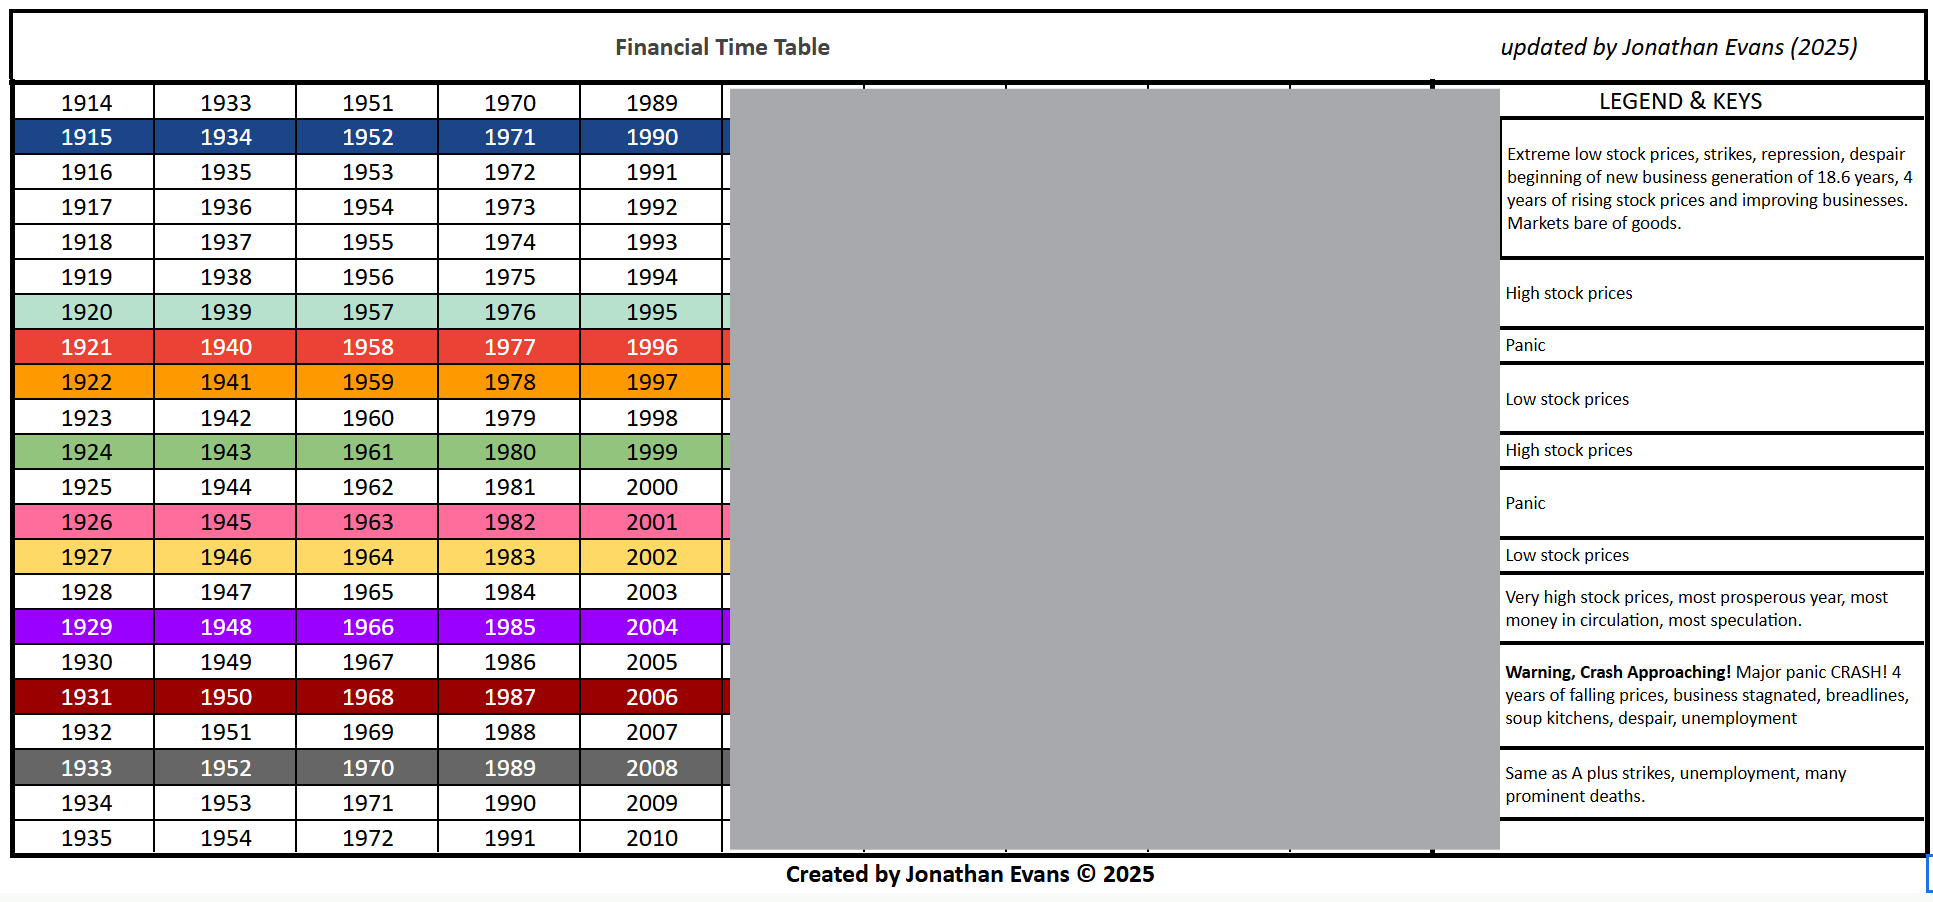
The Recalibrated Timetable
With this bonus, your education in financial forecasting will be more complete than 99.9% of traders on the planet.
The Total Value of This Complete System Is Over $4,185… But You Won’t Pay That Today.
I could easily charge more, and for the serious hedge funds and professional traders who have sought out this kind of information, it would be a bargain. A single good trade based on this knowledge could pay for it ten times over.
But my goal is to get this knowledge into the hands of the serious, independent investor—the person who is ready for a deeper level of understanding.
This is not for dabblers. This is a professional-level toolkit, and it is priced accordingly. Because of the proprietary nature of this material and the immense power it provides, you will be required to sign a Non-Disclosure Agreement (NDA) before you can access the course materials. This is to protect the integrity of the work and the investment of every student in this group.
Your One-Time Investment For A Lifetime of Forecasting Skill Is Just:
$1,994
To preserve the value of this information and the integrity of the private community we are building, global enrollment is strictly capped at 150 students. Furthermore, the price increases in tiers after every 20 enrollments. By enrolling today, you are locking in the current price before the next inevitable increase.
Frequently Asked Questions
Do I need to be an astrologer or know anything about astrology to use this?
Absolutely not. This course is designed for traders and investors, not astrologers. I teach you everything you need to know from the ground up, and provide the tools and worksheets to make it a simple, mechanical process. If you can follow a recipe, you can use this method.
Is this difficult to learn?
The concepts are profound, but the application is simple. Louise McWhirter's genius was in identifying the patterns; my genius is in simplifying her work into a step-by-step system. I've done the hard part—the decades of research and decoding—so you can focus on application.
How is this different from ICT or Smart Money Concepts?
ICT and SMC are powerful methods for reading price action. They study the *effects*—the footprints of price and volume. The McWhirter method studies the *cause*—the underlying celestial cycles that influence mass psychology. All price action analysis is, by its very nature, reactive. It can only tell you what has already happened. This method is a *forecasting* tool. It is designed to give you a directional bias *before* the price patterns emerge.
Why is there a strict No Refund Policy and an NDA?
Because you are not buying a simple product; you are being granted access to proprietary research and a powerful skillset. Once you have this knowledge, it cannot be "returned." The NDA and no-refund policy are in place to protect the integrity and exclusivity of this information for the small group of serious students who invest in it. It ensures you are joining a community of dedicated, trustworthy individuals.
What if I miss out on one of the 150 spots?
Once the cap is reached, enrollment will be closed indefinitely. I do this to ensure the private community remains effective and the information doesn't become diluted. The price also rises with each tier of 20 students, so the price you see now is truly the lowest it will ever be.
A Final, Personal Word...
The choice is yours.
You can continue on the same path, analyzing the same charts as everyone else, chasing the same fleeting signals, and feeling the same frustration when the market doesn't behave as the textbook says it should. You can remain a ship reacting to the waves.
Or you can choose to arm yourself with a map of the tides. A compass that points to the underlying currents. A system rooted in the unwavering laws of nature. You can choose confidence. You can choose clarity. You can choose to become one of the few who truly understand the rhythm of the market.
To your success,
Jonathan Evans
P.S. – The next New Moon is just weeks away. That celestial event will set the market's primary trend for the next 30 days. It will be either a bullish or a bearish signal. The signal will be clear. You will either have this forecast in your hands, or you will be trying to react to the price action it creates. Secure your spot and be prepared.
P.P.S. – Don't forget, you're also getting my complete Gann Financial Timetable course as a free bonus. The combination of Gann's long-term cycle mastery and McWhirter's short-term tactical genius is something that, to my knowledge, has never been offered in a single package, anywhere, at any price. For the true student of market cycles, this is a historic opportunity.
P.P.P.S. – Still on the fence? Ask yourself one question: What is the cost of one more trade taken against the primary trend? What is the cost of missing one more major market turn because you were waiting for confirmation on a chart? I guarantee it's more than the investment in this course. This isn't an expense; it's the smartest investment in your trading career you will ever make. The decision is yours.