WARNING: Your Financial Timetable Is A Useless, Broken Toy... And Here's The Proof They Prayed You'd Never Find.
FROM THE DESK OF: Jonathan Evans, Lead Cyclical Forecaster
LOCATION: Brisbane, Queensland, Australia
CLASSIFICATION: EYES ONLY
DATE: Thursday, October 2, 2025
SUBJECT: The Agony of "Almost Right" and The Decryption Key That Changes Everything
Dear Fellow Gann Researcher,
You've felt it, haven't you? That gut-twisting moment of public humiliation and private financial pain. You did the work. You plotted the cycles. You marked your calendar with the "panic date" from the public Gann timetable—the one passed around in forums and old books for decades.
You told your spouse this was "the big one." You positioned your account. You waited with the sweaty-palmed certainty of a man who thinks he's found the Holy Grail.
And then… nothing. A pathetic market hiccup. The date comes and goes with a whimper, leaving you looking like a fool and feeling the sting of a missed opportunity or, worse, a poorly timed trade based on a map that led you directly into a swamp.
This isn't your fault. You’ve been given a map with a critical printing error. You’ve been trying to navigate the Rocky Mountains with a map of the Alps. The reason the public timetable fails so spectacularly is because it’s a decoy—an incomplete puzzle deliberately left scrambled by Gann himself.
The Brutal Truth: You're Using A Deliberately Flawed Instrument
W.D. Gann was a genius. But he was also a shrewd businessman who guarded his most valuable secrets. The timetable he released to the public was designed to impress, but not to empower. It was a puzzle with crucial pieces missing, designed to frustrate and bankrupt amateurs while keeping the true power for his high-paying private students.
For years, I was one of those frustrated amateurs. After a decade of painstaking research, cross-referencing rare documents, and reverse-engineering his methods, I finally uncovered the master keys—the decryption method that makes the entire map readable again.
The Three "Account-Killing" Flaws In The Public Timetable:
- FLAW #1 - The "Drifting Anchor" Disaster: The public timetable drifts into uselessness because its starting point is arbitrary. Gann anchored his private work to a precise astronomical event: the North Node entering 15° Aquarius. Without this celestial anchor, your entire timeline is off, accumulating error with every passing decade until it's dangerously inaccurate.
- FLAW #2 - The "Mechanical Model" Trap: The alternating 18 and 19-year sequence is a crude mechanical approximation of the true 18.6-year celestial cycle. It's a "one-size-fits-all" model that completely ignores the real-time position of the North Node. You'll learn to ditch the training wheels and use the *actual* astrological positions for surgical precision.
- FLAW #3 - The "Decoupling" Blind Spot: Gann's original work assumed the stock market and business cycle moved in lockstep. In the modern era of massive central bank intervention, this is no longer true. A powerful phenomenon known as **"Decoupling"** allows the stock market to defy economic gravity... temporarily. Ignoring this is the single biggest mistake a modern Gann analyst can make, leading to catastrophic early shorts.
Identifying these flaws is useless without a systematic method to correct them. That is why we developed The Gann Decryption Method™. It's a step-by-step, mathematical and astronomical process for demolishing your old, flawed timetable and building a new one from the ground up—calibrated, corrected, and deadly accurate for the 21st century. And the historical proof is undeniable.
PROOF: The Decrypted Timetable vs. History
Talk is cheap. The charts don't lie. Below are historical turning points that baffled traders using the standard timetable, but were perfectly framed by our Decryption Method.
Exhibit A: The Great Crash of 1929
The ultimate test. The Decryption Method pinpointed the 'J' phase—the "Major Panic Crash" window—with chilling accuracy. It remained open through the entire crash, signaling "EXTREME DANGER" while the public, using their flawed maps, was still buying the dip.
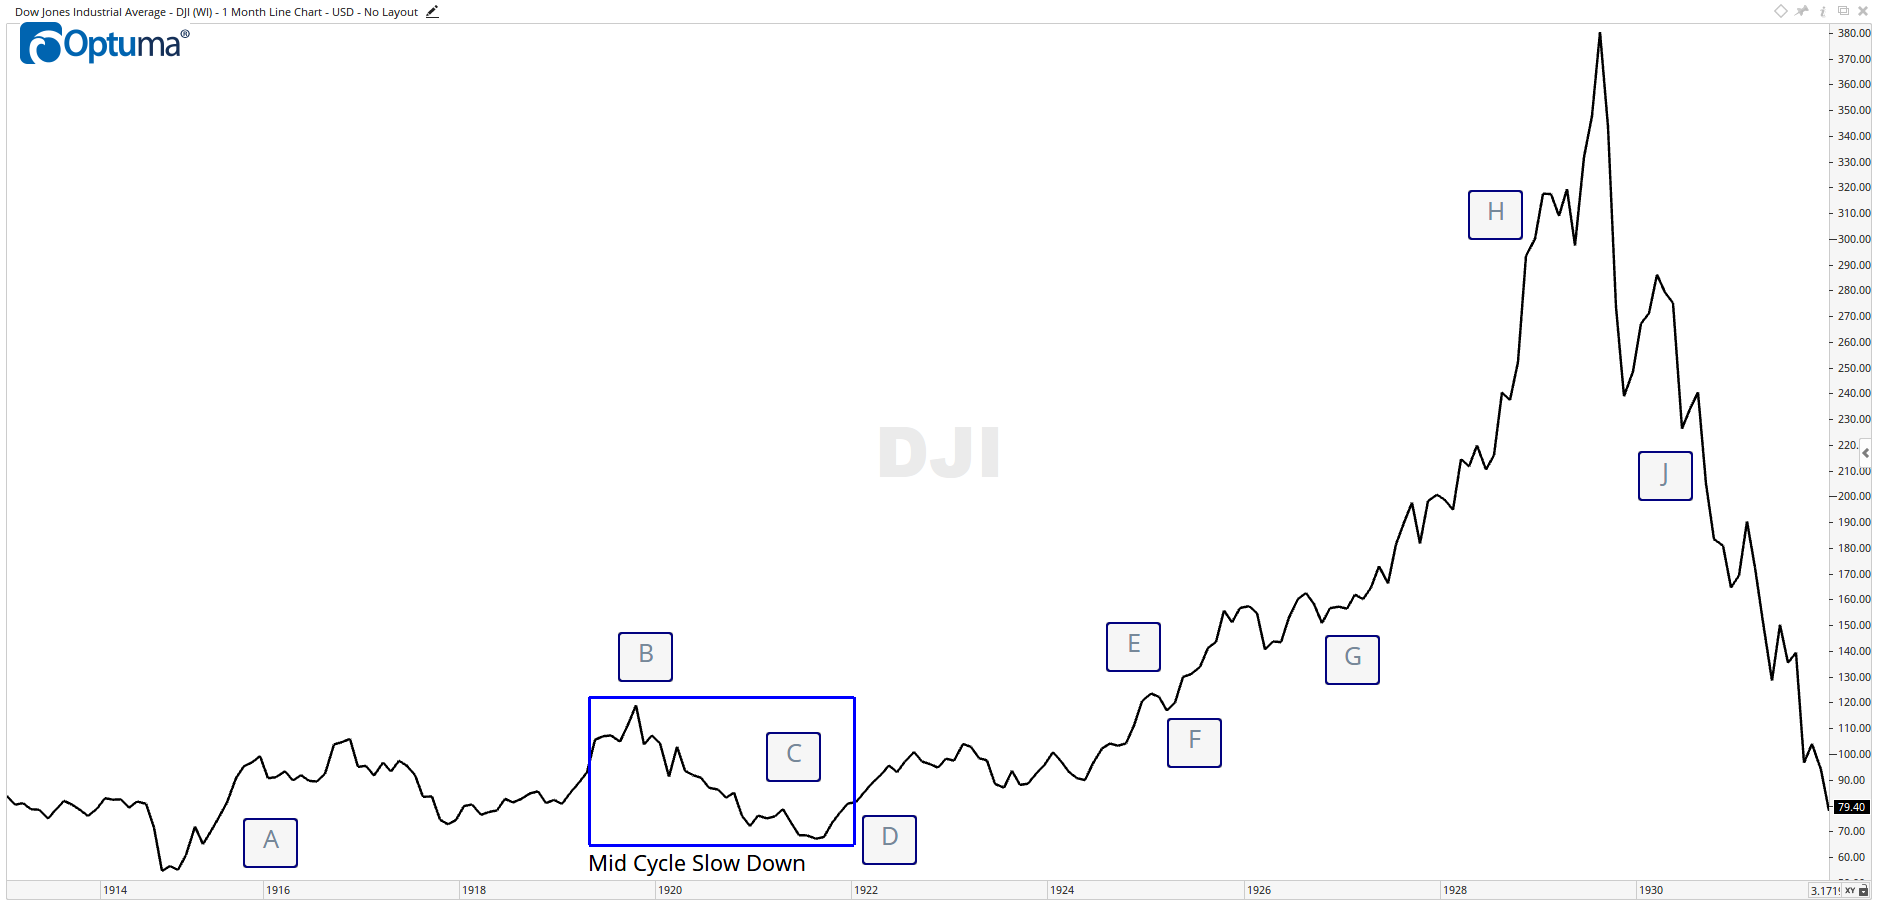
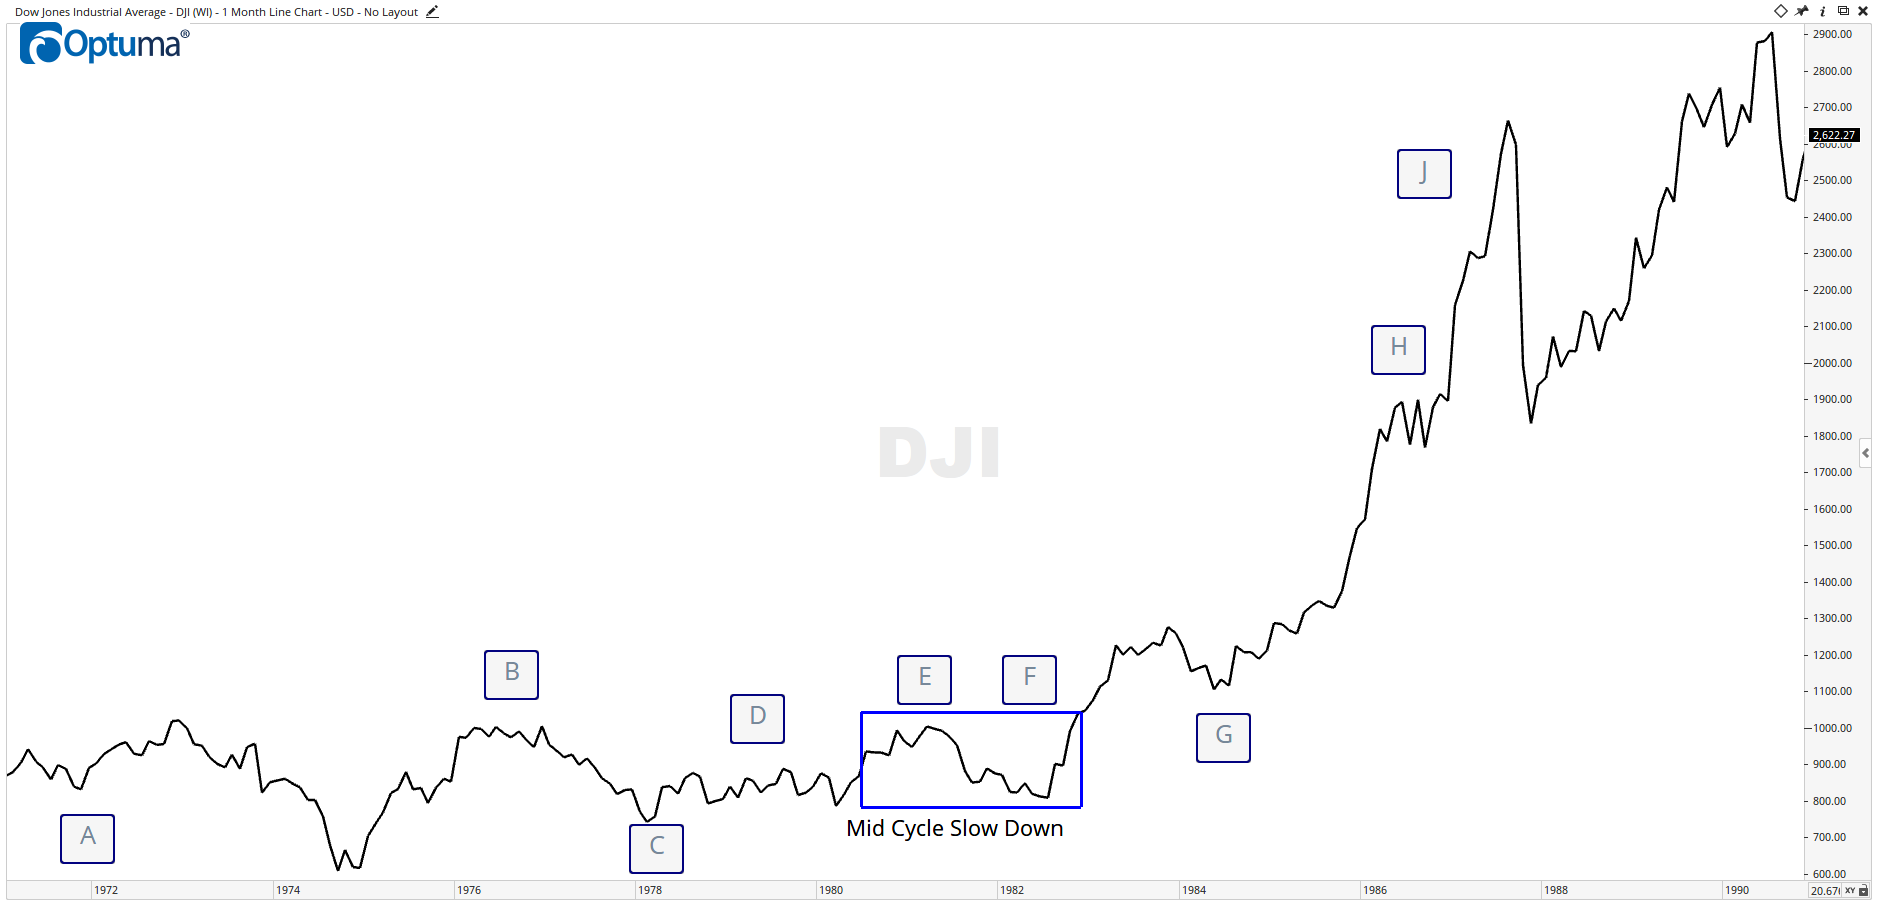
Exhibit B: Black Monday, 1987
Many said this crash came "out of nowhere." It didn't. As the market rocketed up in the summer of '87—deep inside the "Winner's Curse" phase—our Decrypted Timetable had already opened its Panic Window months in advance. Anyone following this map would have been protecting capital instead of chasing the final, fatal rally.
Time and time again, for over a century, the pattern holds. The key is possessing the decryption method.
You Only Get 3-4 Chances In Your ENTIRE Life... Don't Waste Another One With A Broken Compass.
Think about it. In your investing lifetime, you will only see 3 or 4 of these major 18.6-year cycle tops and bottoms. That's it.
- Ages 19-37: Your first cycle. A time for learning and building.
- Ages 38-56: Your second. The peak wealth-building years where one major mistake can set you back a decade.
- Ages 57-75: Your final cycle. There is no time to recover from a 50% drawdown. You must get this one right.
Getting a major turn wrong doesn't just cost you money. It costs you time you can never get back. Our Decryption Method forecasts the next major peak window to open in 2026. While others are fumbling with their flawed maps, you will have a fully calibrated system telling you precisely when the next 4-year market panic is scheduled to begin.
Introducing: The Gann Decryption Method™ Program
This is more than a course; it's a complete apprenticeship in cyclical forecasting. We don't just fix the errors—we give you the complete, multi-layered system Gann used to see the future with startling clarity.
DECLASSIFIED: YOUR COURSE ITINERARY
- Module 1: The Flawed Foundation. We dissect the public timetable piece by piece, proving beyond a shadow of a doubt why its mechanical 18/19 year sequence is a recipe for failure and why Gann's note to "recalibrate in 1989" was the clue that cracked the entire code.
- Module 2: The Celestial Engine. You'll master the true driver of the cycle: the 18.6-year retrograde journey of the Lunar North Node. We'll map its path through the "Sensitive Degrees" of the Zodiac (Aquarius, Leo, Scorpio, etc.) that act as the master control switches for market psychology.
- Module 3: The Narrative of the Cycle. A cycle isn't just a sine wave; it's a story. You'll learn to identify the "Mid-Cycle Slowdown"—the bull market's necessary pause—and the final, euphoric "Winner's Curse" phase, where fortunes are made and lost with astonishing speed.
- Module 4: The Master Keys to Recalibration. This is the core of the Decryption Method. You'll discover the never-before-published **"206-Year Saturn Connection,"** a proprietary cycle discovery that allows for perfect, long-wave recalibration. We also decode the 20-year Jupiter-Saturn "Master Cycle" that Gann hid within his timetable columns.
- Module 5: Modern Application & The Decoupling Theory. The most important module for 21st-century survival. You'll learn how to account for central bank intervention and identify the "Decoupling" between the business cycle and the stock market, ensuring you're not tricked into shorting a liquidity-fueled melt-up before the real crash begins.
MEET YOUR INSTRUCTORS
This method was developed through a collaboration between practical application and deep theory. Jonathan Evans will guide you through the step-by-step construction and application, while our theoretical expert Luna will illuminate the celestial and geometric principles that make it all work.
You Get The Complete Toolkit To Create This...
The end result of this training is your own, fully corrected and Decrypted Financial Timetable. This isn't a static PDF; it's a living, dynamic forecasting tool you will build yourself, giving you an analytical edge that is light-years ahead of anything publicly available.
It's Decision Time.
Is This Elite Training For You?
This program is NOT for beginners looking for hot stock tips. It is a rigorous, professional-grade training designed exclusively for the serious student of W.D. Gann who understands the immense value of his work but is deeply frustrated by the flaws in publicly available material. If you are ready to move from amateur speculation to professional forecasting, this is your path.
You can continue down the path of frustration, trying to force a broken tool to work. Or you can make the professional decision to finally possess the complete, decrypted method Gann himself used to amass a fortune.
This is a serious investment for serious students only. Upon joining, you will be required to sign a Non-Disclosure Agreement (NDA) to protect the proprietary nature of this material. This is a professional toolkit, and we treat it as such.
Your One-Time Investment For A Lifetime of Forecasting Mastery:
$897
To preserve the integrity and value of this information, enrollment is strictly limited. I reserve the right to pull this page down without notice once the current class is full.
YES! I Demand The Complete Decryption MethodSecure Checkout | One-Time Payment | Lifetime Access
A Final, Brutal Warning About The Cost of Inaction
What is the real cost here? It’s not $897. The real cost is the price of continued ignorance. It's the cost of the next "almost right" trade that blows up your account. It's the cost of missing the 2026 turn and losing another 5-10 years of your life trying to recover what you lost.
For less than the price of a single S&P 500 E-mini contract, you are getting a complete, lifelong skillset that can prevent hundreds of catastrophic mistakes and identify countless profitable opportunities. This isn't an expense; it's the cheapest insurance policy against financial ruin you will ever buy.
Do not be a fool. The clock is ticking.
P.S. - Let's not mince words. In three months, you’ll be three months older. The only question is whether you'll be any wiser or just more frustrated. The price of this program is a tiny, one-time investment. The price of continued failure and regret is infinite. Secure your spot now and arm yourself with the correct map.
P.P.S. - Once you understand the **"206-Year Saturn Connection"** from Module 4, you will NEVER look at market history the same way again. It is the master key that locks all the other cycles into place. This single piece of information, which to my knowledge has never been published anywhere else, is worth 10x the price of this entire program.
P.P.P.S. - The NDA and the strict 'No Refund' policy are what guarantee the immense value of your investment. It ensures you are surrounded by producers, not parasites. It's why our students get results. If these terms make you hesitate, then I respectfully ask you to leave. This elite knowledge is not for you.